

V. Zelano . M. Gulmini
that is usually employed for homogeneous solutions (Daniele et al. 1985; Daniele et al.
1991); p and z are the stoichiometric coefficients and charges, respectively, /3(1') the
formation constant at the selected reference ionic strength. In this case, the ligand
corresponds to the donor groups present in each surface-active centre, and eventual
reciprocal influence among the charges of donor group is neglected.
Ionic strength seems to playa marginal role in the reactions between sediment and
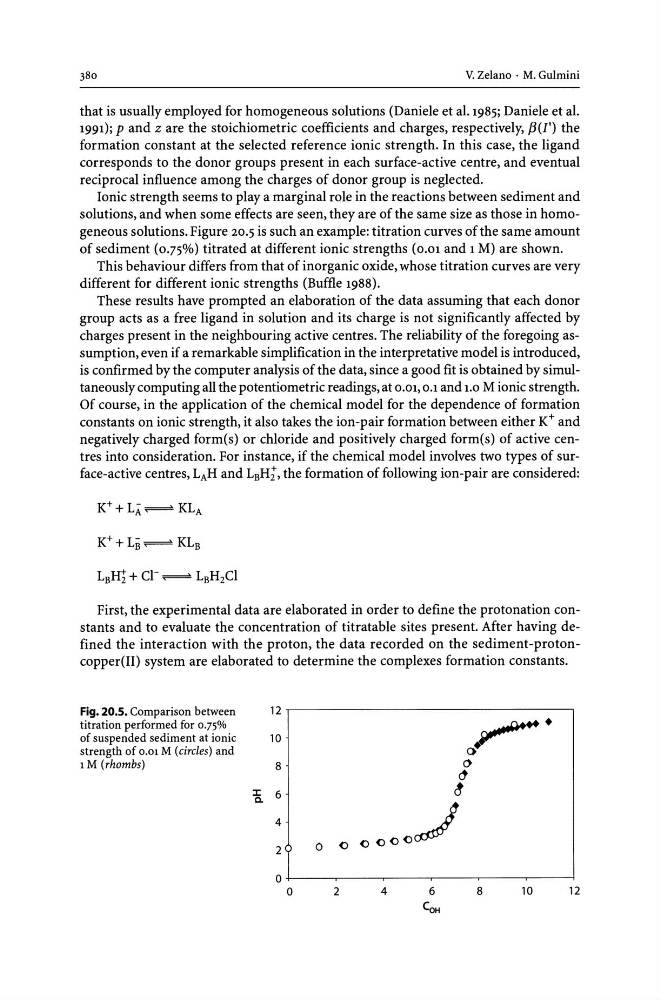
solutions, and when some effects are seen, they are of the same size as those in homogeneous solutions. Figure 20.5 is such an example: titration curves of the same amount
of sediment (0.75%) titrated at different ionic strengths (0.01 and 1 M) are shown.
This behaviour differs from that of inorganic oxide, whose titration curves are very
different for different ionic strengths (Buffle 1988).
These results have prompted an elaboration of the data assuming that each donor
group acts as a free ligand in solution and its charge is not significantly affected by
charges present in the neighbouring active centres. The reliability of the foregoing assumption, even if a remarkable simplification in the interpretative model is introduced,
is confirmed by the computer analysis of the data, since a good fit is obtained by simultaneously computing all the potentiometric readings, at 0.01, 0.1 and 1.0 M ionic strength.
Of course, in the application of the chemical model for the dependence of formation
constants on ionic strength, it also takes the ion-pair formation between either K+ and
negatively charged form(s) or chloride and positively charged form(s) of active centres into consideration. For instance, if the chemical model involves two types of surface-active centres, LAH and LBH;, the formation of following ion-pair are considered:
First, the experimental data are elaborated in order to define the protonation constants and to evaluate the concentration of titratable sites present. After having defined the interaction with the proton, the data recorded on the sediment-protoncopper(II) system are elaborated to determine the complexes formation constants.
Fig. 20.5. Comparison between
titration performed for 0.75%
of suspended sediment at ionic
strength of 0.01 M (circles) and
1 M (rhombs)
12.---------------------------------.
10
8
:a 6
4
2
o
O~----r---~----~----_r----~--~
o
2
4
8
10
12
that is usually employed for homogeneous solutions (Daniele et al. 1985; Daniele et al.
1991); p and z are the stoichiometric coefficients and charges, respectively, /3(1') the
formation constant at the selected reference ionic strength. In this case, the ligand
corresponds to the donor groups present in each surface-active centre, and eventual
reciprocal influence among the charges of donor group is neglected.
Ionic strength seems to playa marginal role in the reactions between sediment and
solutions, and when some effects are seen, they are of the same size as those in homogeneous solutions. Figure 20.5 is such an example: titration curves of the same amount
of sediment (0.75%) titrated at different ionic strengths (0.01 and 1 M) are shown.
This behaviour differs from that of inorganic oxide, whose titration curves are very
different for different ionic strengths (Buffle 1988).
These results have prompted an elaboration of the data assuming that each donor
group acts as a free ligand in solution and its charge is not significantly affected by
charges present in the neighbouring active centres. The reliability of the foregoing assumption, even if a remarkable simplification in the interpretative model is introduced,
is confirmed by the computer analysis of the data, since a good fit is obtained by simultaneously computing all the potentiometric readings, at 0.01, 0.1 and 1.0 M ionic strength.
Of course, in the application of the chemical model for the dependence of formation
constants on ionic strength, it also takes the ion-pair formation between either K+ and
negatively charged form(s) or chloride and positively charged form(s) of active centres into consideration. For instance, if the chemical model involves two types of surface-active centres, LAH and LBH;, the formation of following ion-pair are considered:
First, the experimental data are elaborated in order to define the protonation constants and to evaluate the concentration of titratable sites present. After having defined the interaction with the proton, the data recorded on the sediment-protoncopper(II) system are elaborated to determine the complexes formation constants.
Fig. 20.5. Comparison between
titration performed for 0.75%
of suspended sediment at ionic
strength of 0.01 M (circles) and
1 M (rhombs)
12.---------------------------------.
10
8
:a 6
4
2
o
O~----r---~----~----_r----~--~
o
2
4
8
10
12