

CHAPTER 20 . Potentiometry for the Study of Acid-Base Properties of Sediments
20.6
Results of the Potentiometric Approach
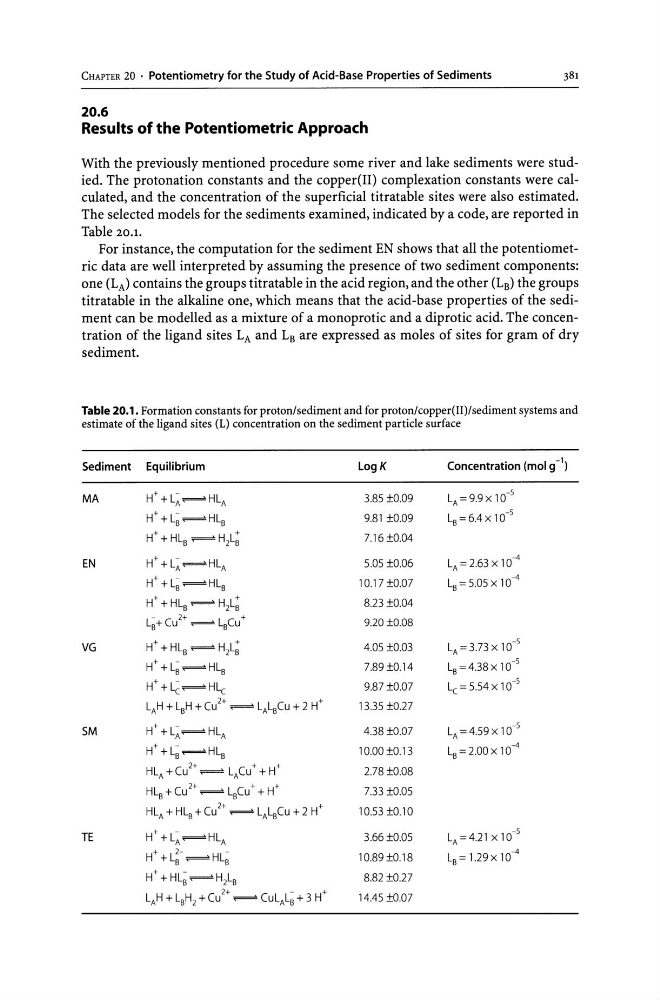
With the previously mentioned procedure some river and lake sediments were studied. The protonation constants and the copper(II) complexation constants were calculated, and the concentration of the superficial titratable sites were also estimated.
The selected models for the sediments examined, indicated by a code, are reported in
Table 20.1.
For instance, the computation for the sediment EN shows that all the potentiometric data are well interpreted by assuming the presence of two sediment components:
one (LA) contains the groups titratable in the acid region, and the other (LB) the groups
titratable in the alkaline one, which means that the acid-base properties of the sediment can be modelled as a mixture of a monoprotic and a diprotic acid. The concentration of the ligand sites LA and LB are expressed as moles of sites for gram of dry
sediment.
Table 20.1. Formation constants for proton/sediment and for proton/copper(II)/sediment systems and
estimate of the ligand sites (L) concentration on the sediment particle surface
Sediment Equilibrium
MA
H+ +L~~HLA
H+ +L;~HLB
H+ + HLB ~ H2L;
EN
H+ +L~~HLA
H+ +L;~HLs
H+ + HLs ~ H2L;
L~+ Cu 2 + ~ LsCu +
VG
H+ + HLs ~ H2L;
H+ +L;~HLs
H+ +L~~HLc
LAH + LBH + Cu 2 + ~ LALsCu + 2 H+
SM
H+ +L~~HLA
H+ +L;~HLs
HLA + Cu 2 + ~ LACu + + H+
HLs+Cu2+ ~ LsCu+ +H+
HLA + HLs + Cu 2 + ~ LALsCu + 2 H+
TE
H+ +L~~HLA
H+ +L~- ~HL;
H+ +HL;~H2Ls
LAH + LsH2 + Cu 2 + ~ CuLAL; + 3 H+
LogK
3.85 ±0.09
9.81 ±0.09
7.16±0.04
5.05 ±0.06
10.17 ±0.07
8.23 ±0.04
9.20 ±0.08
4.05 ±0.03
7.89±0.14
9.87 ±0.07
13.35 ±0.27
4.38 ±0.07
10.00 ±0.13
2.78 ±0.08
7.33 ±0.05
10.53 ±0.10
3.66±0.05
10.89 ±0.18
8.82 ±0.27
14.45 ±0.Q7
Concentration (mol 9 -1)
LA = 9.9 X 10- 5
Ls = 6.4 x 10- 5
LA = 2.63 xl 0- 4
Ls = 5.05 x 10- 4
LA = 3.73 x 10- 5
LB = 4.38 x 10- 5
Lc=5.54X 10- 5
LA =4.59x 10- 5
Ls = 2.00 X 10- 4
LA =4.21 X 10- 5
Ls = 1.29 X 10- 4
20.6
Results of the Potentiometric Approach
With the previously mentioned procedure some river and lake sediments were studied. The protonation constants and the copper(II) complexation constants were calculated, and the concentration of the superficial titratable sites were also estimated.
The selected models for the sediments examined, indicated by a code, are reported in
Table 20.1.
For instance, the computation for the sediment EN shows that all the potentiometric data are well interpreted by assuming the presence of two sediment components:
one (LA) contains the groups titratable in the acid region, and the other (LB) the groups
titratable in the alkaline one, which means that the acid-base properties of the sediment can be modelled as a mixture of a monoprotic and a diprotic acid. The concentration of the ligand sites LA and LB are expressed as moles of sites for gram of dry
sediment.
Table 20.1. Formation constants for proton/sediment and for proton/copper(II)/sediment systems and
estimate of the ligand sites (L) concentration on the sediment particle surface
Sediment Equilibrium
MA
H+ +L~~HLA
H+ +L;~HLB
H+ + HLB ~ H2L;
EN
H+ +L~~HLA
H+ +L;~HLs
H+ + HLs ~ H2L;
L~+ Cu 2 + ~ LsCu +
VG
H+ + HLs ~ H2L;
H+ +L;~HLs
H+ +L~~HLc
LAH + LBH + Cu 2 + ~ LALsCu + 2 H+
SM
H+ +L~~HLA
H+ +L;~HLs
HLA + Cu 2 + ~ LACu + + H+
HLs+Cu2+ ~ LsCu+ +H+
HLA + HLs + Cu 2 + ~ LALsCu + 2 H+
TE
H+ +L~~HLA
H+ +L~- ~HL;
H+ +HL;~H2Ls
LAH + LsH2 + Cu 2 + ~ CuLAL; + 3 H+
LogK
3.85 ±0.09
9.81 ±0.09
7.16±0.04
5.05 ±0.06
10.17 ±0.07
8.23 ±0.04
9.20 ±0.08
4.05 ±0.03
7.89±0.14
9.87 ±0.07
13.35 ±0.27
4.38 ±0.07
10.00 ±0.13
2.78 ±0.08
7.33 ±0.05
10.53 ±0.10
3.66±0.05
10.89 ±0.18
8.82 ±0.27
14.45 ±0.Q7
Concentration (mol 9 -1)
LA = 9.9 X 10- 5
Ls = 6.4 x 10- 5
LA = 2.63 xl 0- 4
Ls = 5.05 x 10- 4
LA = 3.73 x 10- 5
LB = 4.38 x 10- 5
Lc=5.54X 10- 5
LA =4.59x 10- 5
Ls = 2.00 X 10- 4
LA =4.21 X 10- 5
Ls = 1.29 X 10- 4