

CHAPTER 20 . Potentiometry for the Study of Acid-Base Properties of Sediments
379
Of the samples studied thus far, regardless of their origins, it was found that when
less than 0.25% of suspended sediment was used, the titration curve does not differ from
the reference curve, and therefore, this quantity is considered to be the minimum
amount required for the study. On the other hand, for concentrations over 2%, the solid
tends to deposit and does not remain homogeneously suspended in the solution.
The same titration procedure may be used to study the sediment interaction with
metal ions. In this case, the initial solution also contains, in addition to strong acid
and ionic medium, a known concentration of the ion under study.
20.5
Elaboration of the Potentiometric Data
The concentration of titratable sites present is unknown, but may be calculated from
the data of the alkalimetric titrations on the solution-sediment system. This system
is, in fact, a mixture of a strong free acid (HCI) and of a weak acid (sediment). The
titration data may be elaborated to put into evidence the two inflection points, one of
the strong acid (using the Gran plot method), and the other of total acid (derivative of
the titration curve). The difference between the two values corresponds to the concentration of the acidic sites on the sediment.
To select the models which best explain the trend of the experimental data for the
protonation and the complexation between the sediment and the copper(II) ion, the
statistic software BSTAC (De Stefano et al. 1993) may be used. The software employs
an iterative and convergent numeric method which is based upon the linear combination of the mass balance equations. Several chemical models, i.e. stoichiometry and
stability constants of species that are possibly involved in the equilibrium, are loaded
into the software to perform calculations. On the basis of the given models, the software indicates the most probable species and calculates their formation constants by
minimising the sum of squared errors between calculated and experimental EMF values. Since there is a lack of information regarding titratable group concentration, this
parameter is refined together with the protonation constants, and the calculated values are in good agreement (within 5%) with those calculated by the Gran plot and
derivative curve.
The ionic strength and the ionic medium employed may influence, even significantly,
the interaction between the ions in solution and the surface active centres, due to the
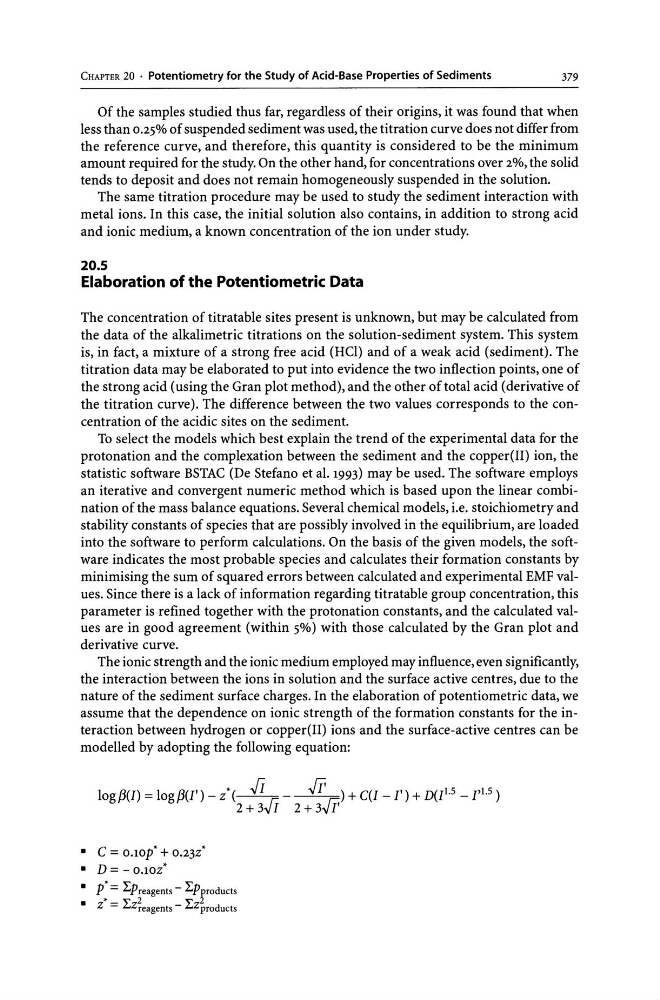
nature of the sediment surface charges. In the elaboration of potentiometric data, we
assume that the dependence on ionic strength of the formation constants for the interaction between hydrogen or copper(II) ions and the surface-active centres can be
modelled by adopting the following equation:
10gfJ(I) = 10gfJ(1') - z*(~ - /i' ) + C(I - I') + D(I1.5 - 1'1.5)
2 + 3..Ji 2 + 3/i'
• C = O.lOp' + 0.23z'
• D = - O.lOZ'
• p' = l:preagents -l:Pproducts
,_ "<' 2
"<' 2
• Z - ,L,Zreagents - ,L,Zproducts
379
Of the samples studied thus far, regardless of their origins, it was found that when
less than 0.25% of suspended sediment was used, the titration curve does not differ from
the reference curve, and therefore, this quantity is considered to be the minimum
amount required for the study. On the other hand, for concentrations over 2%, the solid
tends to deposit and does not remain homogeneously suspended in the solution.
The same titration procedure may be used to study the sediment interaction with
metal ions. In this case, the initial solution also contains, in addition to strong acid
and ionic medium, a known concentration of the ion under study.
20.5
Elaboration of the Potentiometric Data
The concentration of titratable sites present is unknown, but may be calculated from
the data of the alkalimetric titrations on the solution-sediment system. This system
is, in fact, a mixture of a strong free acid (HCI) and of a weak acid (sediment). The
titration data may be elaborated to put into evidence the two inflection points, one of
the strong acid (using the Gran plot method), and the other of total acid (derivative of
the titration curve). The difference between the two values corresponds to the concentration of the acidic sites on the sediment.
To select the models which best explain the trend of the experimental data for the
protonation and the complexation between the sediment and the copper(II) ion, the
statistic software BSTAC (De Stefano et al. 1993) may be used. The software employs
an iterative and convergent numeric method which is based upon the linear combination of the mass balance equations. Several chemical models, i.e. stoichiometry and
stability constants of species that are possibly involved in the equilibrium, are loaded
into the software to perform calculations. On the basis of the given models, the software indicates the most probable species and calculates their formation constants by
minimising the sum of squared errors between calculated and experimental EMF values. Since there is a lack of information regarding titratable group concentration, this
parameter is refined together with the protonation constants, and the calculated values are in good agreement (within 5%) with those calculated by the Gran plot and
derivative curve.
The ionic strength and the ionic medium employed may influence, even significantly,
the interaction between the ions in solution and the surface active centres, due to the
nature of the sediment surface charges. In the elaboration of potentiometric data, we
assume that the dependence on ionic strength of the formation constants for the interaction between hydrogen or copper(II) ions and the surface-active centres can be
modelled by adopting the following equation:
10gfJ(I) = 10gfJ(1') - z*(~ - /i' ) + C(I - I') + D(I1.5 - 1'1.5)
2 + 3..Ji 2 + 3/i'
• C = O.lOp' + 0.23z'
• D = - O.lOZ'
• p' = l:preagents -l:Pproducts
,_ "<' 2
"<' 2
• Z - ,L,Zreagents - ,L,Zproducts