

378
V. Zelano . M. Gulmini
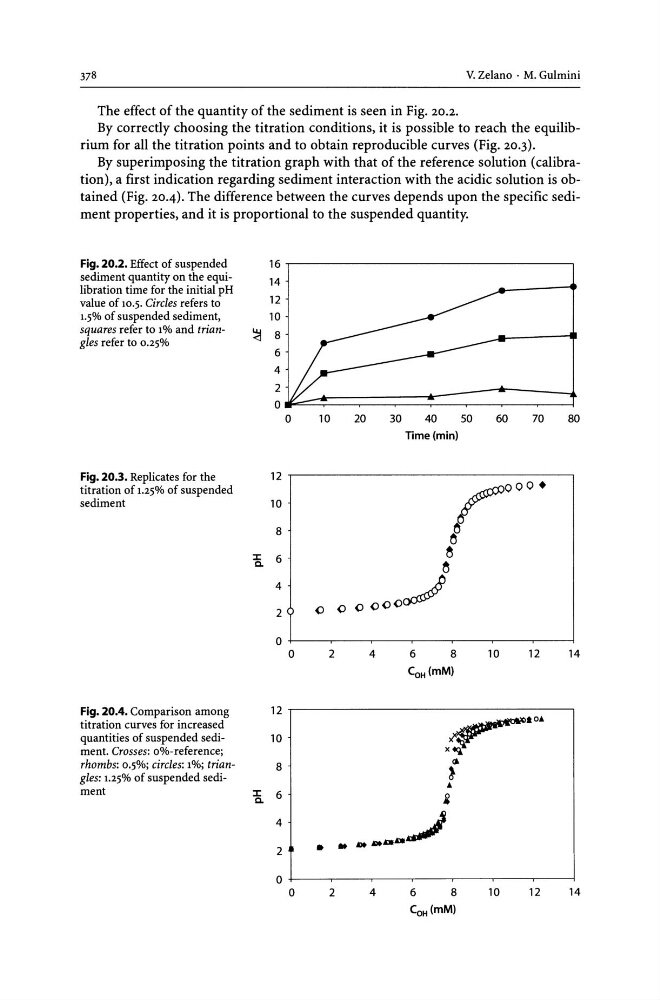
The effect of the quantity of the sediment is seen in Fig. 20.2.
By correctly choosing the titration conditions, it is possible to reach the equilibrium for all the titration points and to obtain reproducible curves (Fig. 20.3).
By superimposing the titration graph with that of the reference solution (calibration), a first indication regarding sediment interaction with the acidic solution is obtained (Fig. 20.4). The difference between the curves depends upon the specific sediment properties, and it is proportional to the suspended quantity.
Fig. 20.2. Effect of suspended
16
sediment quantity on the equi14
libration time for the initial pH
12
value of 10.5. Circles refers to
1.5% of suspended sediment,
10
squares refer to 1% and trian~ 8
gles refer to 0.25%
6
4
2
10
20
30
40
50
60
70
80
Time (min)
Fig. 20.3. Replicates for the
12
titration of 1.25% of suspended
r ooo +
sediment
10
8
~
::J:
6
~
Q.
~
4
<><><><>~
2
<> <>
0
0
2
4
6
8
10
12
14
CoH(mM)
Fig. 20.4. Comparison among
12
titration curves for increased
~*o~
quantities of suspended sedi10
ment. Crosses: o%-reference;
x.,.
rhombs: 0.5%; circles: 1%; trian8
a.
gles: 1.25% of suspended sedi!
~
ment
::J:
6
i
Q.
4
.tI».tI».tI»JDa.J
2
• . .
0
0
2
4
6
8
10
12
14
CoH(mM)
V. Zelano . M. Gulmini
The effect of the quantity of the sediment is seen in Fig. 20.2.
By correctly choosing the titration conditions, it is possible to reach the equilibrium for all the titration points and to obtain reproducible curves (Fig. 20.3).
By superimposing the titration graph with that of the reference solution (calibration), a first indication regarding sediment interaction with the acidic solution is obtained (Fig. 20.4). The difference between the curves depends upon the specific sediment properties, and it is proportional to the suspended quantity.
Fig. 20.2. Effect of suspended
16
sediment quantity on the equi14
libration time for the initial pH
12
value of 10.5. Circles refers to
1.5% of suspended sediment,
10
squares refer to 1% and trian~ 8
gles refer to 0.25%
6
4
2
10
20
30
40
50
60
70
80
Time (min)
Fig. 20.3. Replicates for the
12
titration of 1.25% of suspended
r ooo +
sediment
10
8
~
::J:
6
~
Q.
~
4
<><><><>~
2
<> <>
0
0
2
4
6
8
10
12
14
CoH(mM)
Fig. 20.4. Comparison among
12
titration curves for increased
~*o~
quantities of suspended sedi10
ment. Crosses: o%-reference;
x.,.
rhombs: 0.5%; circles: 1%; trian8
a.
gles: 1.25% of suspended sedi!
~
ment
::J:
6
i
Q.
4
.tI».tI».tI»JDa.J
2
• . .
0
0
2
4
6
8
10
12
14
CoH(mM)