

CHAPTER 4 . Redox Processes in Anoxic Waters
111
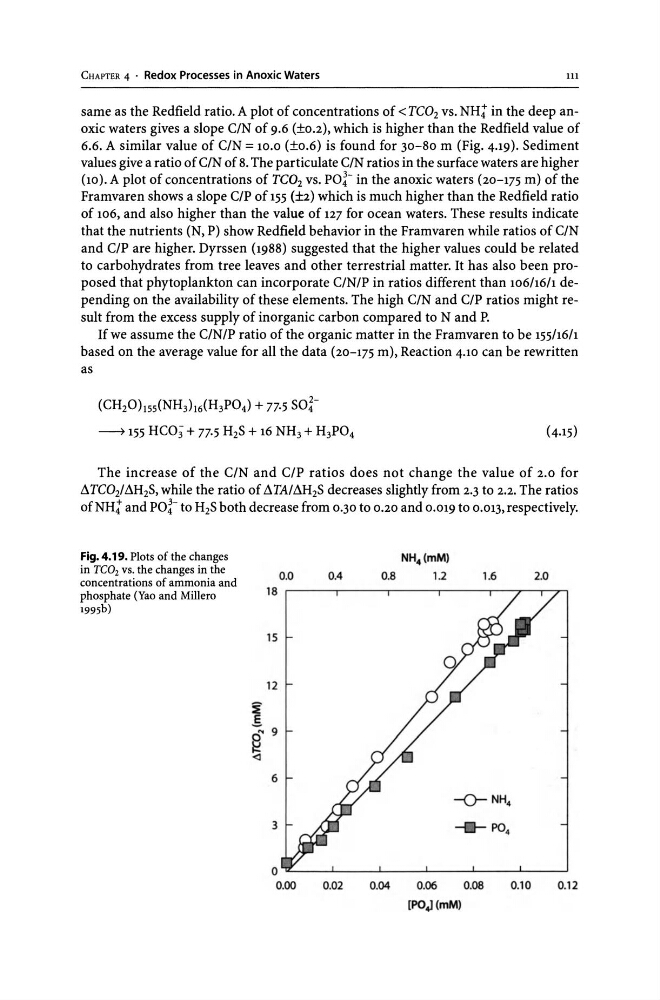
same as the Redfield ratio. A plot of concentrations of < TC02 vs. NH; in the deep anoxic waters gives a slope C/N of 9.6 (±0.2), which is higher than the Redfield value of
6.6. A similar value of C/N = 10.0 (±0.6) is found for 30-80 m (Fig. 4.19). Sediment
values give a ratio of C/N of 8. The particulate C/N ratios in the surface waters are higher
(10). A plot of concentrations of TCOl vs. pol- in the anoxic waters (20-175 m) of the
Framvaren shows a slope C/P of 155 (b) which is much higher than the Redfield ratio
of 106, and also higher than the value of 127 for ocean waters. These results indicate
that the nutrients (N, P) show Redfield behavior in the Framvaren while ratios of C/N
and C/P are higher. Dyrssen (1988) suggested that the higher values could be related
to carbohydrates from tree leaves and other terrestrial matter. It has also been proposed that phytoplankton can incorporate C/N/P in ratios different than 10611611 depending on the availability of these elements. The high C/N and C/P ratios might result from the excess supply of inorganic carbon compared to Nand P.
If we assume the C/N/P ratio of the organic matter in the Framvaren to be 15511611
based on the average value for all the data (20-175 m), Reaction 4.10 can be rewritten
as
(CH20hss(NH3h6(H3P04) + 77.5 soi~ 155 HC03 + 77-5 H2S + 16 NH3 + H3P04
The increase of the C/N and C/P ratios does not change the value of 2.0 for
~TC02/~H2S, while the ratio of ~TA/~H2S decreases slightly from 2.3 to 2.2. The ratios
ofNH; and pol- to H 2 S both decrease from 0.30 to 0.20 and 0.019 to 0.013, respectively.
Fig. 4.19. Plots of the changes
NH 4 (mM)
in Te02 vs. the changes in the
0.0
0.4
0.8
1.2
1.6
2.0
concentrations of ammonia and
phosphate (Yao and Millero
18
1995b)
15
12
~
E
ci'9
~
-0- NH4
3
___ P0
4
0
0.00
0.02
0.04
0.06
0.08
0.10
0.12
(PO,J(mM)
111
same as the Redfield ratio. A plot of concentrations of < TC02 vs. NH; in the deep anoxic waters gives a slope C/N of 9.6 (±0.2), which is higher than the Redfield value of
6.6. A similar value of C/N = 10.0 (±0.6) is found for 30-80 m (Fig. 4.19). Sediment
values give a ratio of C/N of 8. The particulate C/N ratios in the surface waters are higher
(10). A plot of concentrations of TCOl vs. pol- in the anoxic waters (20-175 m) of the
Framvaren shows a slope C/P of 155 (b) which is much higher than the Redfield ratio
of 106, and also higher than the value of 127 for ocean waters. These results indicate
that the nutrients (N, P) show Redfield behavior in the Framvaren while ratios of C/N
and C/P are higher. Dyrssen (1988) suggested that the higher values could be related
to carbohydrates from tree leaves and other terrestrial matter. It has also been proposed that phytoplankton can incorporate C/N/P in ratios different than 10611611 depending on the availability of these elements. The high C/N and C/P ratios might result from the excess supply of inorganic carbon compared to Nand P.
If we assume the C/N/P ratio of the organic matter in the Framvaren to be 15511611
based on the average value for all the data (20-175 m), Reaction 4.10 can be rewritten
as
(CH20hss(NH3h6(H3P04) + 77.5 soi~ 155 HC03 + 77-5 H2S + 16 NH3 + H3P04
The increase of the C/N and C/P ratios does not change the value of 2.0 for
~TC02/~H2S, while the ratio of ~TA/~H2S decreases slightly from 2.3 to 2.2. The ratios
ofNH; and pol- to H 2 S both decrease from 0.30 to 0.20 and 0.019 to 0.013, respectively.
Fig. 4.19. Plots of the changes
NH 4 (mM)
in Te02 vs. the changes in the
0.0
0.4
0.8
1.2
1.6
2.0
concentrations of ammonia and
phosphate (Yao and Millero
18
1995b)
15
12
~
E
ci'9
~
-0- NH4
3
___ P0
4
0
0.00
0.02
0.04
0.06
0.08
0.10
0.12
(PO,J(mM)