

110
F.J. Millero
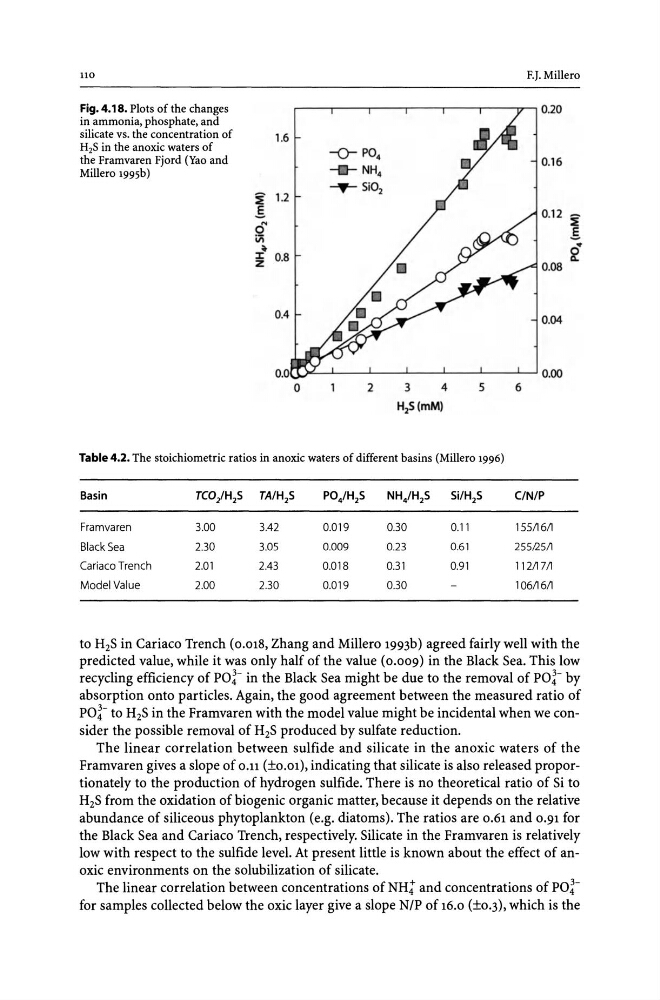
Fig. 4.18. Plots of the changes
0.20
in ammonia, phosphate, and
silicate vs. the concentration of
1.6
H2S in the anoxic waters of
-0- P04
the Framvaren Fjord (Yao and
0.16
Millero 1995b)
NH4
~ 1.2
~Si02
g
0.12 ~
N
0
g
iii
'Z. 0.8
2·
z
0.08
0.4
0.04
0.0
0.00
0
2
3
4
5
6
HzS(mM)
Table 4.2. The stoichiometric ratios in anoxic waters of different basins (Millero 1996)
Basin
TCOJHzS TA/HzS
P0 4 /H z S
NHiHzS
Si/HzS
C/N/P
Framvaren
3.00
3.42
0.019
0.30
0.11
155/16/1
Black Sea
2.30
3.05
0.009
0.23
0.61
25512511
Cariaco Trench
2.01
2.43
0.018
0.31
0.91
112117/1
Model Value
2.00
2.30
0.019
0.30
106/16/1
to HzS in Cariaco Trench (0.018, Zhang and Millero 1993b) agreed fairly well with the
predicted value, while it was only half of the value (0.009) in the Black Sea. This low
recycling efficiency of PO~- in the Black Sea might be due to the removal of pol- by
absorption onto particles. Again, the good agreement between the measured ratio of
pol- to HzS in the Framvaren with the model value might be incidental when we consider the possible removal of HzS produced by sulfate reduction.
The linear correlation between sulfide and silicate in the anoxic waters of the
Framvaren gives a slope of O.ll (±O.O1), indicating that silicate is also released proportionately to the production of hydrogen sulfide. There is no theoretical ratio of Si to
HzS from the oxidation of biogenic organic matter, because it depends on the relative
abundance of siliceous phytoplankton (e.g. diatoms). The ratios are 0.61 and 0.91 for
the Black Sea and Cariaco Trench, respectively. Silicate in the Framvaren is relatively
low with respect to the sulfide level. At present little is known about the effect of anoxic environments on the solubilization of silicate.
The linear correlation between concentrations of NH: and concentrations of polfor samples collected below the oxic layer give a slope NIP of 16.0 (±0.3), which is the
F.J. Millero
Fig. 4.18. Plots of the changes
0.20
in ammonia, phosphate, and
silicate vs. the concentration of
1.6
H2S in the anoxic waters of
-0- P04
the Framvaren Fjord (Yao and
0.16
Millero 1995b)
NH4
~ 1.2
~Si02
g
0.12 ~
N
0
g
iii
'Z. 0.8
2·
z
0.08
0.4
0.04
0.0
0.00
0
2
3
4
5
6
HzS(mM)
Table 4.2. The stoichiometric ratios in anoxic waters of different basins (Millero 1996)
Basin
TCOJHzS TA/HzS
P0 4 /H z S
NHiHzS
Si/HzS
C/N/P
Framvaren
3.00
3.42
0.019
0.30
0.11
155/16/1
Black Sea
2.30
3.05
0.009
0.23
0.61
25512511
Cariaco Trench
2.01
2.43
0.018
0.31
0.91
112117/1
Model Value
2.00
2.30
0.019
0.30
106/16/1
to HzS in Cariaco Trench (0.018, Zhang and Millero 1993b) agreed fairly well with the
predicted value, while it was only half of the value (0.009) in the Black Sea. This low
recycling efficiency of PO~- in the Black Sea might be due to the removal of pol- by
absorption onto particles. Again, the good agreement between the measured ratio of
pol- to HzS in the Framvaren with the model value might be incidental when we consider the possible removal of HzS produced by sulfate reduction.
The linear correlation between sulfide and silicate in the anoxic waters of the
Framvaren gives a slope of O.ll (±O.O1), indicating that silicate is also released proportionately to the production of hydrogen sulfide. There is no theoretical ratio of Si to
HzS from the oxidation of biogenic organic matter, because it depends on the relative
abundance of siliceous phytoplankton (e.g. diatoms). The ratios are 0.61 and 0.91 for
the Black Sea and Cariaco Trench, respectively. Silicate in the Framvaren is relatively
low with respect to the sulfide level. At present little is known about the effect of anoxic environments on the solubilization of silicate.
The linear correlation between concentrations of NH: and concentrations of polfor samples collected below the oxic layer give a slope NIP of 16.0 (±0.3), which is the