

CHAPTER 22 • Organic Matter Sources and Dynamics in Adriatic Coastal Waters
479
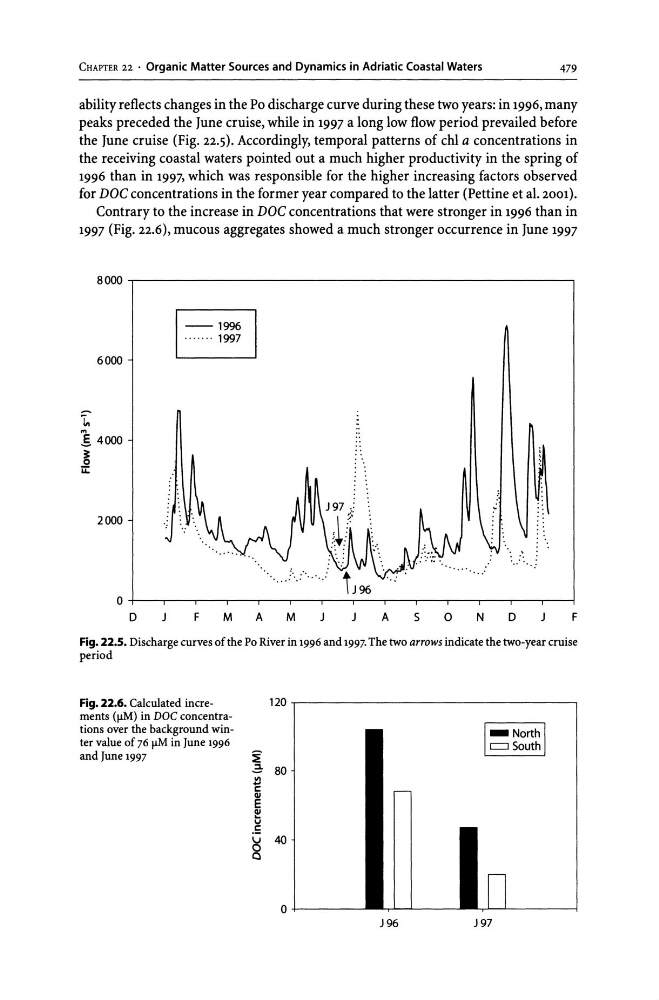
ability reflects changes in the Po discharge curve during these two years: in 1996, many
peaks preceded the June cruise, while in 1997 a long low flow period prevailed before
the June cruise (Fig. 22.5). Accordingly, temporal patterns of chI a concentrations in
the receiving coastal waters pointed out a much higher productivity in the spring of
1996 than in 1997, which was responsible for the higher increasing factors observed
for DOC concentrations in the former year compared to the latter (Pettine et al. 2001).
Contrary to the increase in DOC concentrations that were stronger in 1996 than in
1997 (Fig. 22.6), mucous aggregates showed a much stronger occurrence in June 1997
8~.------------------------------------------------------.
6000
"1,
14000
~
u::
2000
o
D
I·· ... ··:~ I
F
M
A
"
',:
M
A
S
o N D
F
Fig. 22.5. Discharge curves of the Po River in 1996 and 1997. The two arrows indicate the two-year cruise
period
Fig. 22.6. Calculated increments (liM) in DOC concentrations over the background winter value of 76 liM in June 1996
and June 1997
120r---------------------------~
~
2: 80
~
c:
~
~
v
.=
~ 40
o
0+1-----'
J 96
J 97
479
ability reflects changes in the Po discharge curve during these two years: in 1996, many
peaks preceded the June cruise, while in 1997 a long low flow period prevailed before
the June cruise (Fig. 22.5). Accordingly, temporal patterns of chI a concentrations in
the receiving coastal waters pointed out a much higher productivity in the spring of
1996 than in 1997, which was responsible for the higher increasing factors observed
for DOC concentrations in the former year compared to the latter (Pettine et al. 2001).
Contrary to the increase in DOC concentrations that were stronger in 1996 than in
1997 (Fig. 22.6), mucous aggregates showed a much stronger occurrence in June 1997
8~.------------------------------------------------------.
6000
"1,
14000
~
u::
2000
o
D
I·· ... ··:~ I
F
M
A
"
',:
M
A
S
o N D
F
Fig. 22.5. Discharge curves of the Po River in 1996 and 1997. The two arrows indicate the two-year cruise
period
Fig. 22.6. Calculated increments (liM) in DOC concentrations over the background winter value of 76 liM in June 1996
and June 1997
120r---------------------------~
~
2: 80
~
c:
~
~
v
.=
~ 40
o
0+1-----'
J 96
J 97