

478
M. Pettine . L. Patrolecco . S. Capri
(4 tonnes km -2 year -1; MeybeckI 982). Therefore, although the Po exhibits a higher TOC
discharge compared to other Mediterranean rivers, its TOC export rate does not suggest a marked alteration by anthropogenic activity, pointing out that the self-purification capacity of the river is able to maintain organic matter concentrations at a low
level in the lower stretch.
22.S
Interannual Variability of DOC Concentrations in NA Coastal Waters
DOC concentrations have been measured on more than 400 samples from surface and
deep waters at different distances from the Po mouth in two frontal regions, (Pettine
et al. 1999 and 2001). The location of these frontal regions, which could move depending on the seasonal period, is exemplified in Fig. 22.2 for the June 1996 cruise. The
overall ranges of DOC concentrations and salinity resulting from all the four cruises
were 70 to 280 flM and 30 to 38, respectively. Average DOC values in the four cruises
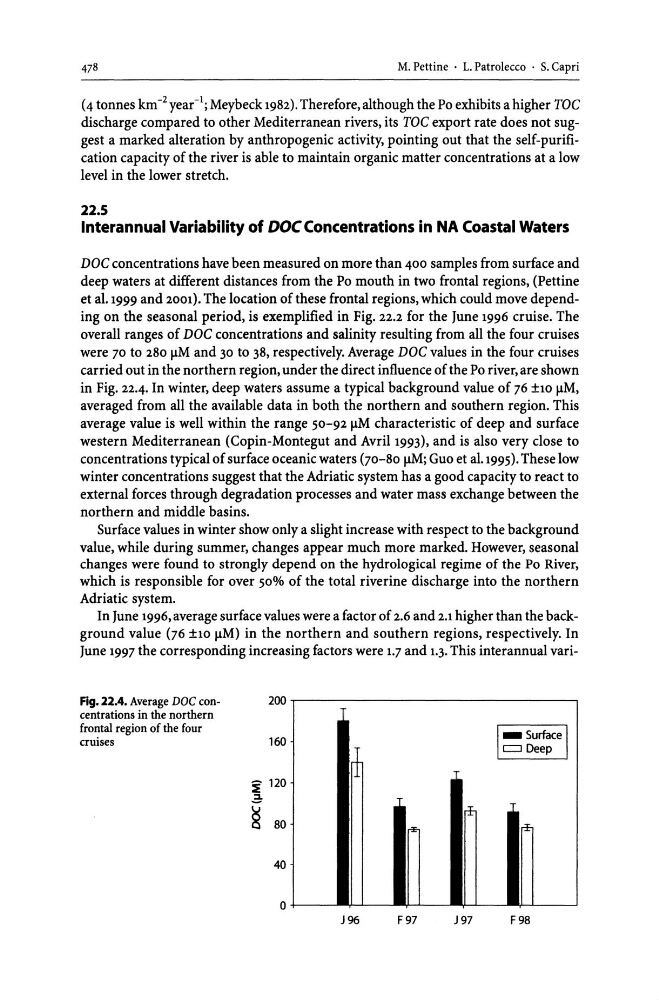
carried out in the northern region, under the direct influence of the Po river, are shown
in Fig. 22.4. In winter, deep waters assume a typical background value of 76 ±10 flM,
averaged from all the available data in both the northern and southern region. This
average value is well within the range 50-92 flM characteristic of deep and surface
western Mediterranean (Copin-Montegut and Avril 1993), and is also very close to
concentrations typical of surface oceanic waters (70-80 flM; Guo et al.1995). These low
winter concentrations suggest that the Adriatic system has a good capacity to react to
external forces through degradation processes and water mass exchange between the
northern and middle basins.
Surface values in winter show only a slight increase with respect to the background
value, while during summer, changes appear much more marked. However, seasonal
changes were found to strongly depend on the hydrological regime of the Po River,
which is responsible for over 50% of the total riverine discharge into the northern
Adriatic system.
In June 1996, average surface values were a factor of 2.6 and 2.1 higher than the background value (76 ±10 J.1M) in the northern and southern regions, respectively. In
June 1997 the corresponding increasing factors were 1.7 and 1.3. This interannual variFig. 22.4. Average DOC con200
centrations in the northern
frontal region of the four
cru~~
100
~ 120
~
~ 80
40
o
J96
~ ~
F97
J97
F98
M. Pettine . L. Patrolecco . S. Capri
(4 tonnes km -2 year -1; MeybeckI 982). Therefore, although the Po exhibits a higher TOC
discharge compared to other Mediterranean rivers, its TOC export rate does not suggest a marked alteration by anthropogenic activity, pointing out that the self-purification capacity of the river is able to maintain organic matter concentrations at a low
level in the lower stretch.
22.S
Interannual Variability of DOC Concentrations in NA Coastal Waters
DOC concentrations have been measured on more than 400 samples from surface and
deep waters at different distances from the Po mouth in two frontal regions, (Pettine
et al. 1999 and 2001). The location of these frontal regions, which could move depending on the seasonal period, is exemplified in Fig. 22.2 for the June 1996 cruise. The
overall ranges of DOC concentrations and salinity resulting from all the four cruises
were 70 to 280 flM and 30 to 38, respectively. Average DOC values in the four cruises
carried out in the northern region, under the direct influence of the Po river, are shown
in Fig. 22.4. In winter, deep waters assume a typical background value of 76 ±10 flM,
averaged from all the available data in both the northern and southern region. This
average value is well within the range 50-92 flM characteristic of deep and surface
western Mediterranean (Copin-Montegut and Avril 1993), and is also very close to
concentrations typical of surface oceanic waters (70-80 flM; Guo et al.1995). These low
winter concentrations suggest that the Adriatic system has a good capacity to react to
external forces through degradation processes and water mass exchange between the
northern and middle basins.
Surface values in winter show only a slight increase with respect to the background
value, while during summer, changes appear much more marked. However, seasonal
changes were found to strongly depend on the hydrological regime of the Po River,
which is responsible for over 50% of the total riverine discharge into the northern
Adriatic system.
In June 1996, average surface values were a factor of 2.6 and 2.1 higher than the background value (76 ±10 J.1M) in the northern and southern regions, respectively. In
June 1997 the corresponding increasing factors were 1.7 and 1.3. This interannual variFig. 22.4. Average DOC con200
centrations in the northern
frontal region of the four
cru~~
100
~ 120
~
~ 80
40
o
J96
~ ~
F97
J97
F98