

CHAPTER 20 • Studies of Water Masses Mixing in the Ross Sea (Antarctica)
453
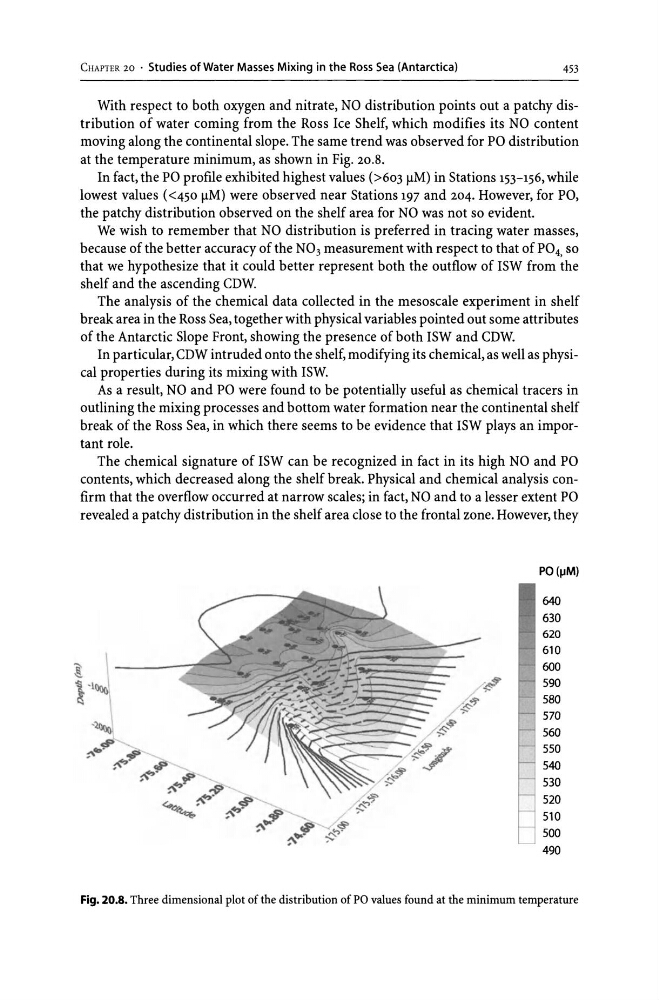
With respect to both oxygen and nitrate, NO distribution points out a patchy distribution of water coming from the Ross Ice Shelf, which modifies its NO content
moving along the continental slope. The same trend was observed for PO distribution
at the temperature minimum, as shown in Fig. 20.S.
In fact, the PO profile exhibited highest values (>603 jlM) in Stations 153-156, while
lowest values «450 jlM) were observed near Stations 197 and 204. However, for PO,
the patchy distribution observed on the shelf area for NO was not so evident.
We wish to remember that NO distribution is preferred in tracing water masses,
because of the better accuracy of the N03 measurement with respect to that of P04, so
that we hypothesize that it could better represent both the outflow of ISW from the
shelf and the ascending CDW.
The analysis of the chemical data collected in the mesoscale experiment in shelf
break area in the Ross Sea, together with physical variables pointed out some attributes
of the Antarctic Slope Front, showing the presence of both ISW and CDW.
In particular, CDW intruded onto the shelf, modifying its chemical, as well as physical properties during its mixing with ISW.
As a result, NO and PO were found to be potentially useful as chemical tracers in
outlining the mixing processes and bottom water formation near the continental shelf
break of the Ross Sea, in which there seems to be evidence that ISW plays an important role.
The chemical signature of ISW can be recognized in fact in its high NO and PO
contents, which decreased along the shelf break. Physical and chemical analysis confirm that the overflow occurred at narrow scales; in fact, NO and to a lesser extent PO
revealed a patchy distribution in the shelf area close to the frontal zone. However, they
PO (11M)
640
630
620
610
~ ~
_.; - - -
.... ,,;:,. 'h,,~ ~
i' \
~"
-p; r-. -
590
-L
... ~~..
,
-
E #
"7 / .
,~
,
....
,,~,
~-"
.
.- .
//:/jjf:;;'~ ~..:.s-. . :~ _~.,.
. . 580
570
560
550
540
530
520
510
500
490
Fig. 20.S. Three dimensional plot of the distribution of PO values found at the minimum temperature
453
With respect to both oxygen and nitrate, NO distribution points out a patchy distribution of water coming from the Ross Ice Shelf, which modifies its NO content
moving along the continental slope. The same trend was observed for PO distribution
at the temperature minimum, as shown in Fig. 20.S.
In fact, the PO profile exhibited highest values (>603 jlM) in Stations 153-156, while
lowest values «450 jlM) were observed near Stations 197 and 204. However, for PO,
the patchy distribution observed on the shelf area for NO was not so evident.
We wish to remember that NO distribution is preferred in tracing water masses,
because of the better accuracy of the N03 measurement with respect to that of P04, so
that we hypothesize that it could better represent both the outflow of ISW from the
shelf and the ascending CDW.
The analysis of the chemical data collected in the mesoscale experiment in shelf
break area in the Ross Sea, together with physical variables pointed out some attributes
of the Antarctic Slope Front, showing the presence of both ISW and CDW.
In particular, CDW intruded onto the shelf, modifying its chemical, as well as physical properties during its mixing with ISW.
As a result, NO and PO were found to be potentially useful as chemical tracers in
outlining the mixing processes and bottom water formation near the continental shelf
break of the Ross Sea, in which there seems to be evidence that ISW plays an important role.
The chemical signature of ISW can be recognized in fact in its high NO and PO
contents, which decreased along the shelf break. Physical and chemical analysis confirm that the overflow occurred at narrow scales; in fact, NO and to a lesser extent PO
revealed a patchy distribution in the shelf area close to the frontal zone. However, they
PO (11M)
640
630
620
610
~ ~
_.; - - -
.... ,,;:,. 'h,,~ ~
i' \
~"
-p; r-. -
590
-L
... ~~..
,
-
E #
"7 / .
,~
,
....
,,~,
~-"
.
.- .
//:/jjf:;;'~ ~..:.s-. . :~ _~.,.
. . 580
570
560
550
540
530
520
510
500
490
Fig. 20.S. Three dimensional plot of the distribution of PO values found at the minimum temperature