

CHAPTER 20 • Studies of Water Masses Mixing in the Ross Sea (Antarctica)
449
vious surveys (1995 CLIMA Project Cruise). In this area, a mesoscale experiment was
carried out after a large-scale synoptic survey aimed at monitoring the general hydrological characteristics of the Ross Sea.
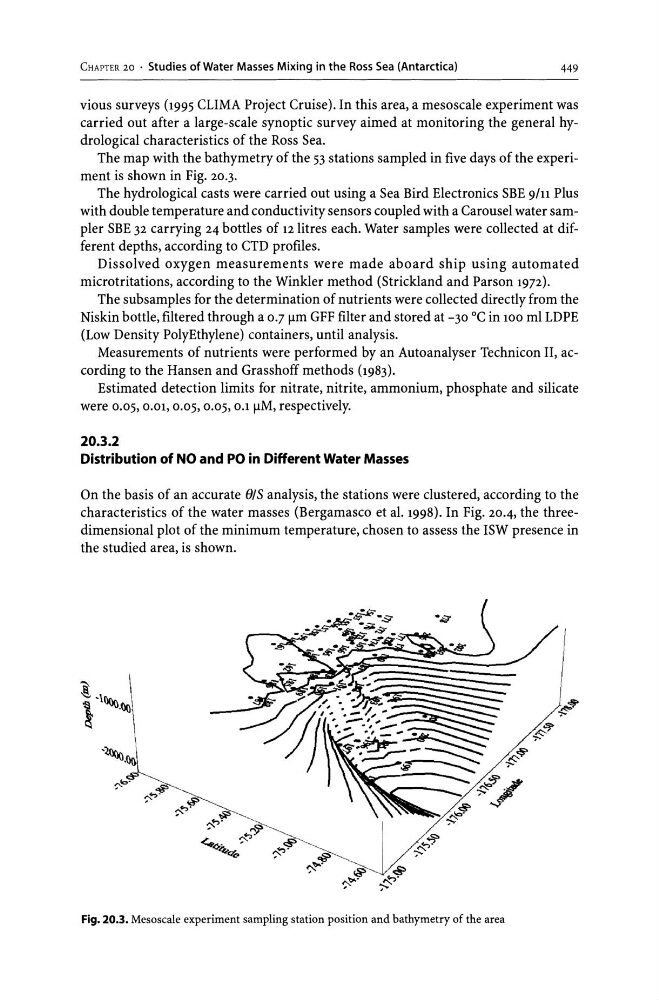
The map with the bathymetry of the 53 stations sampled in five days of the experiment is shown in Fig. 20.3.
The hydrological casts were carried out using a Sea Bird Electronics SBE 9/11 Plus
with double temperature and conductivity sensors coupled with a Carousel water sampler SBE 32 carrying 24 bottles of 12litres each. Water samples were collected at different depths, according to CTD profiles.
Dissolved oxygen measurements were made aboard ship using automated
microtritations, according to the Winkler method (Strickland and Parson 1972).
The subsamples for the determination of nutrients were collected directly from the
Niskin bottle, filtered through a 0.7 Ilm GFF filter and stored at -30°C in 100 ml LDPE
(Low Density PolyEthylene) containers, until analysis.
Measurements of nutrients were performed by an Autoanalyser Technicon II, according to the Hansen and Grasshoff methods (1983).
Estimated detection limits for nitrate, nitrite, ammonium, phosphate and silicate
were 0.05,0.01,0.05,0.05, 0.1 IlM, respectively.
20.3.2
Distribution of NO and PO in Different Water Masses
On the basis of an accurate e/s analysis, the stations were clustered, according to the
characteristics of the water masses (Bergamasco et al. 1998). In Fig. 20.4, the threedimensional plot of the minimum temperature, chosen to assess the ISW presence in
the studied area, is shown.
'i
\
l-\%()'~
-~~
"b~~ , .,.
~ ,,""
------~~
,
"..,. ,...,. .~'~
,.
""..,.
~--.'~
4()o~c.>&'
~.
Fig. 20.3. Mesoscale experiment sampling station position and bathymetry of the area
!<:-~
';-.
k-~
".
I
I
",I!!o- ".
449
vious surveys (1995 CLIMA Project Cruise). In this area, a mesoscale experiment was
carried out after a large-scale synoptic survey aimed at monitoring the general hydrological characteristics of the Ross Sea.
The map with the bathymetry of the 53 stations sampled in five days of the experiment is shown in Fig. 20.3.
The hydrological casts were carried out using a Sea Bird Electronics SBE 9/11 Plus
with double temperature and conductivity sensors coupled with a Carousel water sampler SBE 32 carrying 24 bottles of 12litres each. Water samples were collected at different depths, according to CTD profiles.
Dissolved oxygen measurements were made aboard ship using automated
microtritations, according to the Winkler method (Strickland and Parson 1972).
The subsamples for the determination of nutrients were collected directly from the
Niskin bottle, filtered through a 0.7 Ilm GFF filter and stored at -30°C in 100 ml LDPE
(Low Density PolyEthylene) containers, until analysis.
Measurements of nutrients were performed by an Autoanalyser Technicon II, according to the Hansen and Grasshoff methods (1983).
Estimated detection limits for nitrate, nitrite, ammonium, phosphate and silicate
were 0.05,0.01,0.05,0.05, 0.1 IlM, respectively.
20.3.2
Distribution of NO and PO in Different Water Masses
On the basis of an accurate e/s analysis, the stations were clustered, according to the
characteristics of the water masses (Bergamasco et al. 1998). In Fig. 20.4, the threedimensional plot of the minimum temperature, chosen to assess the ISW presence in
the studied area, is shown.
'i
\
l-\%()'~
-~~
"b~~ , .,.
~ ,,""
------~~
,
"..,. ,...,. .~'~
,.
""..,.
~--.'~
4()o~c.>&'
~.
Fig. 20.3. Mesoscale experiment sampling station position and bathymetry of the area
!<:-~
';-.
k-~
".
I
I
",I!!o- ".