

438
S. Wakeham
22 +I------~.-----~-.--~~----~------~-----.~----~--.---~
21
20
p
- 19
~
!<" 18
~'"
17
16
15 I
2
o
10
20
30
3
40
Age (kyr)
658°C
~
5
50
60
70
80
22 +I----~~----~_r--~----~------~--_.~-----L_.--~
21
20
P
- 19
~
;1;; 18
17
16
2
3
4
5
15 +I------~~----._~--~------_r------,_----~r_----_.--~--~
o
10
20
30
40
Age (kyr)
50
60
70
80
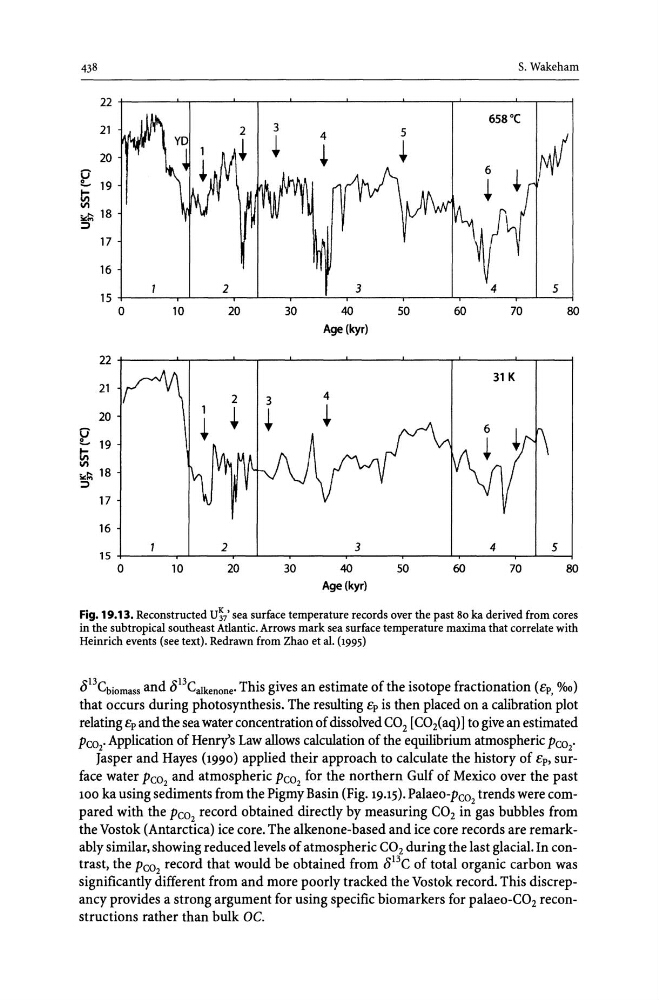
Fig. 19.13. Reconstructed U~/ sea surface temperature records over the past 80 ka derived from cores
in the subtropical southeast Atlantic. Arrows mark sea surface temperature maxima that correlate with
Heinrich events (see text). Redrawn from Zhao et al. (1995)
813Cbiomass and 813Calkenone' This gives an estimate of the isotope fractionation (lOp, %0)
that occurs during photosynthesis. The resulting lOp is then placed on a calibration plot
relating lOp and the sea water concentration of dissolved CO 2 [C0 2 (aq) 1 to give an estimated
Pco 2 • Application of Hemy's Law allows calculation of the equilibrium atmospheric Pco 2 •
Jasper and Hayes (1990) applied their approach to calculate the history of lOp, surface water Pe0 2 and atmospheric Pe0 2 for the northern Gulf of Mexico over the past
100 ka using sediments from the Pigmy Basin (Fig. 19.15). Palaeo-Peo 2 trends were compared with the Peo 2 record obtained directly by measuring CO2 in gas bubbles from
the Vostok (Antarctica) ice core. The alkenone-based and ice core records are remarkably similar, showing reduced levels of atmospheric CO 2 during the last glacial. In contrast, the Pco 2 record that would be obtained from 8 13 C of total organic carbon was
significantly different from and more poorly tracked the Vostok record. This discrepancy provides a strong argument for using specific biomarkers for palaeo-C02 reconstructions rather than bulk OC.
S. Wakeham
22 +I------~.-----~-.--~~----~------~-----.~----~--.---~
21
20
p
- 19
~
!<" 18
~'"
17
16
15 I
2
o
10
20
30
3
40
Age (kyr)
658°C
~
5
50
60
70
80
22 +I----~~----~_r--~----~------~--_.~-----L_.--~
21
20
P
- 19
~
;1;; 18
17
16
2
3
4
5
15 +I------~~----._~--~------_r------,_----~r_----_.--~--~
o
10
20
30
40
Age (kyr)
50
60
70
80
Fig. 19.13. Reconstructed U~/ sea surface temperature records over the past 80 ka derived from cores
in the subtropical southeast Atlantic. Arrows mark sea surface temperature maxima that correlate with
Heinrich events (see text). Redrawn from Zhao et al. (1995)
813Cbiomass and 813Calkenone' This gives an estimate of the isotope fractionation (lOp, %0)
that occurs during photosynthesis. The resulting lOp is then placed on a calibration plot
relating lOp and the sea water concentration of dissolved CO 2 [C0 2 (aq) 1 to give an estimated
Pco 2 • Application of Hemy's Law allows calculation of the equilibrium atmospheric Pco 2 •
Jasper and Hayes (1990) applied their approach to calculate the history of lOp, surface water Pe0 2 and atmospheric Pe0 2 for the northern Gulf of Mexico over the past
100 ka using sediments from the Pigmy Basin (Fig. 19.15). Palaeo-Peo 2 trends were compared with the Peo 2 record obtained directly by measuring CO2 in gas bubbles from
the Vostok (Antarctica) ice core. The alkenone-based and ice core records are remarkably similar, showing reduced levels of atmospheric CO 2 during the last glacial. In contrast, the Pco 2 record that would be obtained from 8 13 C of total organic carbon was
significantly different from and more poorly tracked the Vostok record. This discrepancy provides a strong argument for using specific biomarkers for palaeo-C02 reconstructions rather than bulk OC.