

CHAPTER 18 . Affinity Electrochemical Biosensors for Pollution Control
419
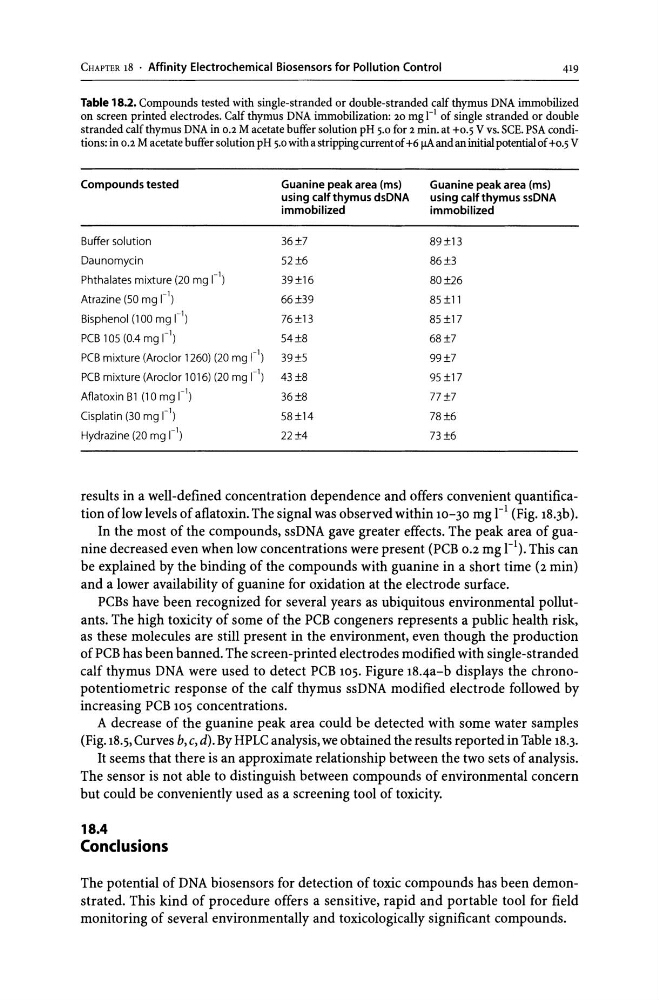
Table 18.2. Compounds tested with single-stranded or double-stranded calf thymus DNA immobilized
on screen printed electrodes. Calf thymus DNA immobilization: 20 mg t 1 of single stranded or double
stranded calf thymus DNA in 0.2 M acetate buffer solution pH 5.0 for 2 min. at +0.5 V VS. SeE. PSA conditions: in 0.2 M acetate buffer solution pH 5.0 with a stripping current of +6 f1A and an initial potential of +0.5 V
Compounds tested
Buffer solution
Daunomycin
Phthalates mixture (20 mg 1-')
Atrazine (50 mg 1-')
Bisphenol (100 mg 1-')
PCB 105 (0.4 mg 1-')
PCB mixture (Aroclor 1260) (20 mg 1-')
PCB mixture (Aroclor 1016) (20 mg 1-')
Aflatoxin B1 (10 mg 1-')
Cisplatin (30 mg 1-')
Hydrazine (20 mg 1-')
Guanine peak area (ms)
using calf thymus dsDNA
immobilized
36±7
52±6
39±16
66±39
76±13
54±8
39±5
43±8
36±8
58±14
22±4
Guanine peak area (ms)
using calfthymus ssDNA
immobilized
89±13
86±3
80±26
85±11
85±17
68±7
99±7
95±17
77±7
78±6
73±6
results in a well-defined concentration dependence and offers convenient quantification oflow levels of aflatoxin. The signal was observed within 10-30 mg rl (Fig. 18.3b).
In the most of the compounds, ssDNA gave greater effects. The peak area of guanine decreased even when low concentrations were present (PCB 0.2 mg rl). This can
be explained by the binding of the compounds with guanine in a short time (2 min)
and a lower availability of guanine for oxidation at the electrode surface.
PCBs have been recognized for several years as ubiquitous environmental pollutants. The high toxicity of some of the PCB congeners represents a public health risk,
as these molecules are still present in the environment, even though the production
of PCB has been banned. The screen-printed electrodes modified with single-stranded
calf thymus DNA were used to detect PCB 105. Figure 18.4a-b displays the chronopotentiometric response of the calf thymus ssDNA modified electrode followed by
increasing PCB 105 concentrations.
A decrease of the guanine peak area could be detected with some water samples
(Fig. 18.5, Curves b, c, d). By HPLC analysis, we obtained the results reported in Table 18.3.
It seems that there is an approximate relationship between the two sets of analysis.
The sensor is not able to distinguish between compounds of environmental concern
but could be conveniently used as a screening tool of toxicity.
18.4
Conclusions
The potential of DNA biosensors for detection of toxic compounds has been demonstrated. This kind of procedure offers a sensitive, rapid and portable tool for field
monitoring of several environmentally and toxicologically significant compounds.
419
Table 18.2. Compounds tested with single-stranded or double-stranded calf thymus DNA immobilized
on screen printed electrodes. Calf thymus DNA immobilization: 20 mg t 1 of single stranded or double
stranded calf thymus DNA in 0.2 M acetate buffer solution pH 5.0 for 2 min. at +0.5 V VS. SeE. PSA conditions: in 0.2 M acetate buffer solution pH 5.0 with a stripping current of +6 f1A and an initial potential of +0.5 V
Compounds tested
Buffer solution
Daunomycin
Phthalates mixture (20 mg 1-')
Atrazine (50 mg 1-')
Bisphenol (100 mg 1-')
PCB 105 (0.4 mg 1-')
PCB mixture (Aroclor 1260) (20 mg 1-')
PCB mixture (Aroclor 1016) (20 mg 1-')
Aflatoxin B1 (10 mg 1-')
Cisplatin (30 mg 1-')
Hydrazine (20 mg 1-')
Guanine peak area (ms)
using calf thymus dsDNA
immobilized
36±7
52±6
39±16
66±39
76±13
54±8
39±5
43±8
36±8
58±14
22±4
Guanine peak area (ms)
using calfthymus ssDNA
immobilized
89±13
86±3
80±26
85±11
85±17
68±7
99±7
95±17
77±7
78±6
73±6
results in a well-defined concentration dependence and offers convenient quantification oflow levels of aflatoxin. The signal was observed within 10-30 mg rl (Fig. 18.3b).
In the most of the compounds, ssDNA gave greater effects. The peak area of guanine decreased even when low concentrations were present (PCB 0.2 mg rl). This can
be explained by the binding of the compounds with guanine in a short time (2 min)
and a lower availability of guanine for oxidation at the electrode surface.
PCBs have been recognized for several years as ubiquitous environmental pollutants. The high toxicity of some of the PCB congeners represents a public health risk,
as these molecules are still present in the environment, even though the production
of PCB has been banned. The screen-printed electrodes modified with single-stranded
calf thymus DNA were used to detect PCB 105. Figure 18.4a-b displays the chronopotentiometric response of the calf thymus ssDNA modified electrode followed by
increasing PCB 105 concentrations.
A decrease of the guanine peak area could be detected with some water samples
(Fig. 18.5, Curves b, c, d). By HPLC analysis, we obtained the results reported in Table 18.3.
It seems that there is an approximate relationship between the two sets of analysis.
The sensor is not able to distinguish between compounds of environmental concern
but could be conveniently used as a screening tool of toxicity.
18.4
Conclusions
The potential of DNA biosensors for detection of toxic compounds has been demonstrated. This kind of procedure offers a sensitive, rapid and portable tool for field
monitoring of several environmentally and toxicologically significant compounds.