

420
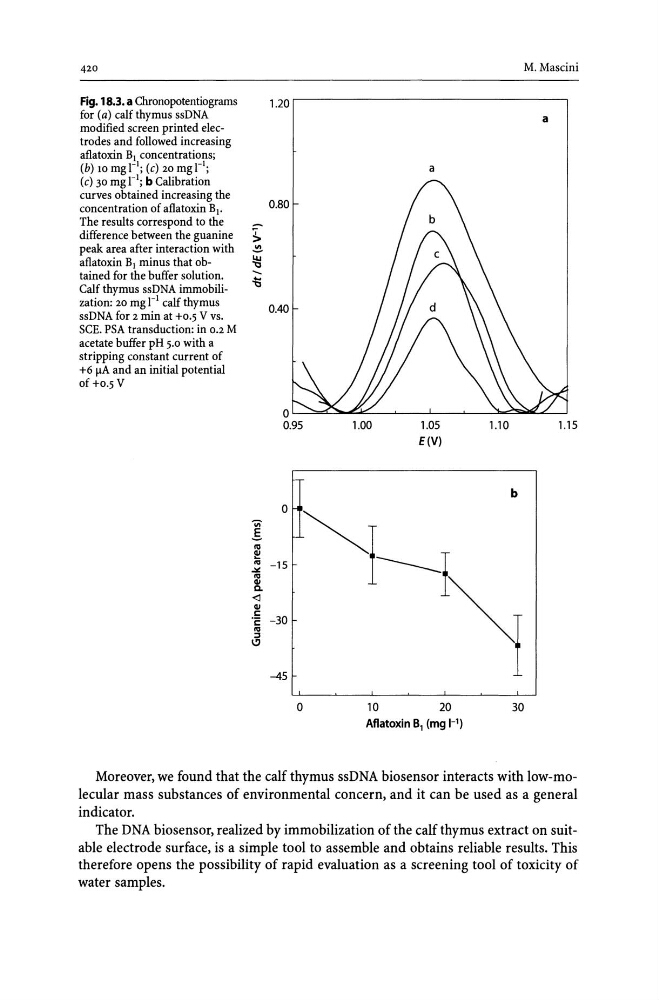
Fig. 18.3. a Chronopotentiograms
for (a) calf thymus ssDNA
modified screen printed electrodes and followed increasing
aflatoxin BI concentrations;
(b) 10 mg rl; (c) 20 mg rl;
(c) 30 mgrl; b Calibration
curves obtained increasing the
concentration of aflatoxin BI .
The results correspond to the
difference between the guanine
peak area after interaction with
aflatoxin BI minus that obtained for the buffer solution.
Calf thymus ssDNA immobilization: 20 mg I-I calf thymus
ssDNA for 2 min at +0.5 V vs.
SCE. PSA transduction: in 0.2 M
acetate buffer pH 5.0 with a
stripping constant current of
+6 j.lA and an initial potential
of +0.5 V
M. Mascini
1.20 r , - - - - - - - - - - - - - - - - - - - - ,
a
a
~
$
~
.....
~
1.00
1.05
1.10
1.15
E(V)
b
i°'1~
~ -30
I
\!J
-45 t,
30
20
10
1-1)
0
Aflatoxin Bl (mg
Moreover, we found that the calf thymus ssDNA biosensor interacts with low-molecular mass substances of environmental concern, and it can be used as a general
indicator.
The DNA biosensor, realized by immobilization of the calf thymus extract on suitable electrode surface, is a simple tool to assemble and obtains reliable results. This
therefore opens the possibility of rapid evaluation as a screening tool of toxicity of
water samples.
Fig. 18.3. a Chronopotentiograms
for (a) calf thymus ssDNA
modified screen printed electrodes and followed increasing
aflatoxin BI concentrations;
(b) 10 mg rl; (c) 20 mg rl;
(c) 30 mgrl; b Calibration
curves obtained increasing the
concentration of aflatoxin BI .
The results correspond to the
difference between the guanine
peak area after interaction with
aflatoxin BI minus that obtained for the buffer solution.
Calf thymus ssDNA immobilization: 20 mg I-I calf thymus
ssDNA for 2 min at +0.5 V vs.
SCE. PSA transduction: in 0.2 M
acetate buffer pH 5.0 with a
stripping constant current of
+6 j.lA and an initial potential
of +0.5 V
M. Mascini
1.20 r , - - - - - - - - - - - - - - - - - - - - ,
a
a
~
$
~
.....
~
1.00
1.05
1.10
1.15
E(V)
b
i°'1~
~ -30
I
\!J
-45 t,
30
20
10
1-1)
0
Aflatoxin Bl (mg
Moreover, we found that the calf thymus ssDNA biosensor interacts with low-molecular mass substances of environmental concern, and it can be used as a general
indicator.
The DNA biosensor, realized by immobilization of the calf thymus extract on suitable electrode surface, is a simple tool to assemble and obtains reliable results. This
therefore opens the possibility of rapid evaluation as a screening tool of toxicity of
water samples.