

400
P. J. Worsfold . E. P. Achterberg. A. R. Bowie· R. Sandford· V. Cannizzaro· P. Gardolinski
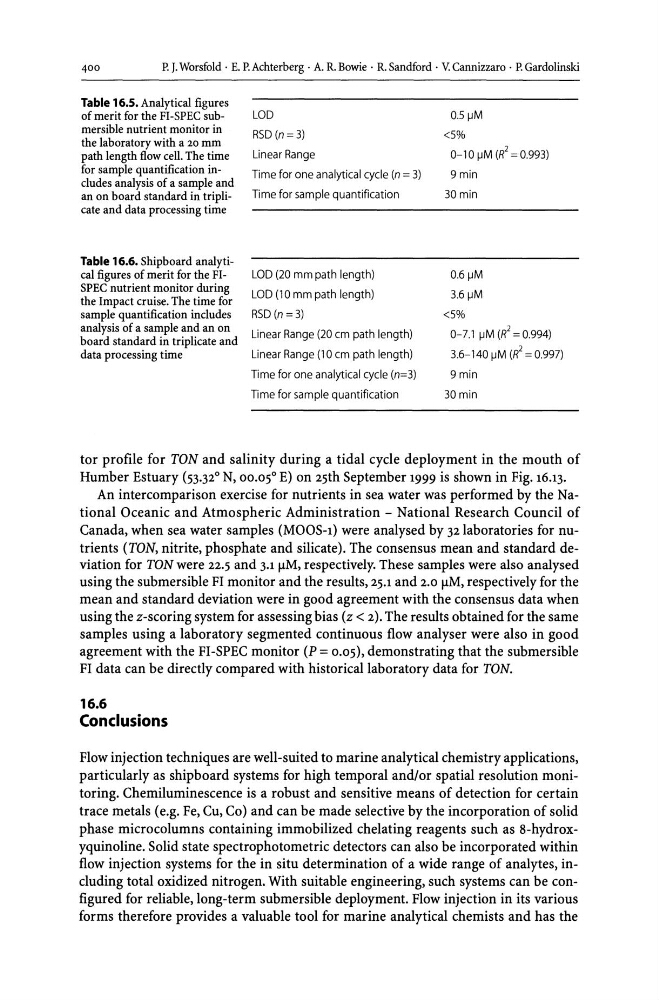
Table 16.5. Analytical figures
of merit for the FI-SPEC submersible nutrient monitor in
the laboratory with a 20 mm
path length flow cell. The time
for sample quantification includes analysis of a sample and
an on board standard in triplicate and data processing time
Table 16.6. Shipboard analytical figures of merit for the FISPEC nutrient monitor during
the Impact cruise. The time for
sample quantification includes
analysis of a sample and an on
board standard in triplicate and
data processing time
LOD
RSD (n = 3)
Linear Range
Time for one analytical cycle (n = 3)
Time for sample quantification
LOD (20 mm path length)
LOD (10 mm path length)
RSD (n =3)
Linear Range (20 cm path length)
Linear Range (10 cm path length)
Time for one analytical cycle (n=3)
Time for sample quantification
0.5 iJM
<5%
0-10 iJM (R 2 = 0.993)
9min
30min
0.6iJM
3.6iJM
<5%
0-7.1 iJM (R 2 = 0.994)
3.6-140 iJM (R 2 = 0.997)
9min
30min
tor profile for TON and salinity during a tidal cycle deployment in the mouth of
Humber Estuary (53.32° N, 00.05° E) on 25th September 1999 is shown in Fig. 16.13.
An intercomparison exercise for nutrients in sea water was performed by the National Oceanic and Atmospheric Administration - National Research Council of
Canada, when sea water samples (MOOS-I) were analysed by 32 laboratories for nutrients (TON, nitrite, phosphate and silicate). The consensus mean and standard deviation for TON were 22.5 and 3.1 j-lM, respectively. These samples were also analysed
using the submersible FI monitor and the results, 25.1 and 2.0 j-lM, respectively for the
mean and standard deviation were in good agreement with the consensus data when
using the z-scoring system for assessing bias (z < 2). The results obtained for the same
samples using a laboratory segmented continuous flow analyser were also in good
agreement with the FI-SPEC monitor (P = 0.05), demonstrating that the submersible
FI data can be directly compared with historical laboratory data for TON.
16.6
Conclusions
Flow injection techniques are well-suited to marine analytical chemistry applications,
particularly as shipboard systems for high temporal and/or spatial resolution monitoring. Chemiluminescence is a robust and sensitive means of detection for certain
trace metals (e.g. Fe, Cu, Co) and can be made selective by the incorporation of solid
phase microcolumns containing immobilized chelating reagents such as 8-hydroxyquinoline. Solid state spectrophotometric detectors can also be incorporated within
flow injection systems for the in situ determination of a wide range of analytes, including total oxidized nitrogen. With suitable engineering, such systems can be configured for reliable, long-term submersible deployment. Flow injection in its various
forms therefore provides a valuable tool for marine analytical chemists and has the
P. J. Worsfold . E. P. Achterberg. A. R. Bowie· R. Sandford· V. Cannizzaro· P. Gardolinski
Table 16.5. Analytical figures
of merit for the FI-SPEC submersible nutrient monitor in
the laboratory with a 20 mm
path length flow cell. The time
for sample quantification includes analysis of a sample and
an on board standard in triplicate and data processing time
Table 16.6. Shipboard analytical figures of merit for the FISPEC nutrient monitor during
the Impact cruise. The time for
sample quantification includes
analysis of a sample and an on
board standard in triplicate and
data processing time
LOD
RSD (n = 3)
Linear Range
Time for one analytical cycle (n = 3)
Time for sample quantification
LOD (20 mm path length)
LOD (10 mm path length)
RSD (n =3)
Linear Range (20 cm path length)
Linear Range (10 cm path length)
Time for one analytical cycle (n=3)
Time for sample quantification
0.5 iJM
<5%
0-10 iJM (R 2 = 0.993)
9min
30min
0.6iJM
3.6iJM
<5%
0-7.1 iJM (R 2 = 0.994)
3.6-140 iJM (R 2 = 0.997)
9min
30min
tor profile for TON and salinity during a tidal cycle deployment in the mouth of
Humber Estuary (53.32° N, 00.05° E) on 25th September 1999 is shown in Fig. 16.13.
An intercomparison exercise for nutrients in sea water was performed by the National Oceanic and Atmospheric Administration - National Research Council of
Canada, when sea water samples (MOOS-I) were analysed by 32 laboratories for nutrients (TON, nitrite, phosphate and silicate). The consensus mean and standard deviation for TON were 22.5 and 3.1 j-lM, respectively. These samples were also analysed
using the submersible FI monitor and the results, 25.1 and 2.0 j-lM, respectively for the
mean and standard deviation were in good agreement with the consensus data when
using the z-scoring system for assessing bias (z < 2). The results obtained for the same
samples using a laboratory segmented continuous flow analyser were also in good
agreement with the FI-SPEC monitor (P = 0.05), demonstrating that the submersible
FI data can be directly compared with historical laboratory data for TON.
16.6
Conclusions
Flow injection techniques are well-suited to marine analytical chemistry applications,
particularly as shipboard systems for high temporal and/or spatial resolution monitoring. Chemiluminescence is a robust and sensitive means of detection for certain
trace metals (e.g. Fe, Cu, Co) and can be made selective by the incorporation of solid
phase microcolumns containing immobilized chelating reagents such as 8-hydroxyquinoline. Solid state spectrophotometric detectors can also be incorporated within
flow injection systems for the in situ determination of a wide range of analytes, including total oxidized nitrogen. With suitable engineering, such systems can be configured for reliable, long-term submersible deployment. Flow injection in its various
forms therefore provides a valuable tool for marine analytical chemists and has the