

CHAPTER 16 . Flow Injection Techniques for the in situ Monitoring of Marine Processes
399
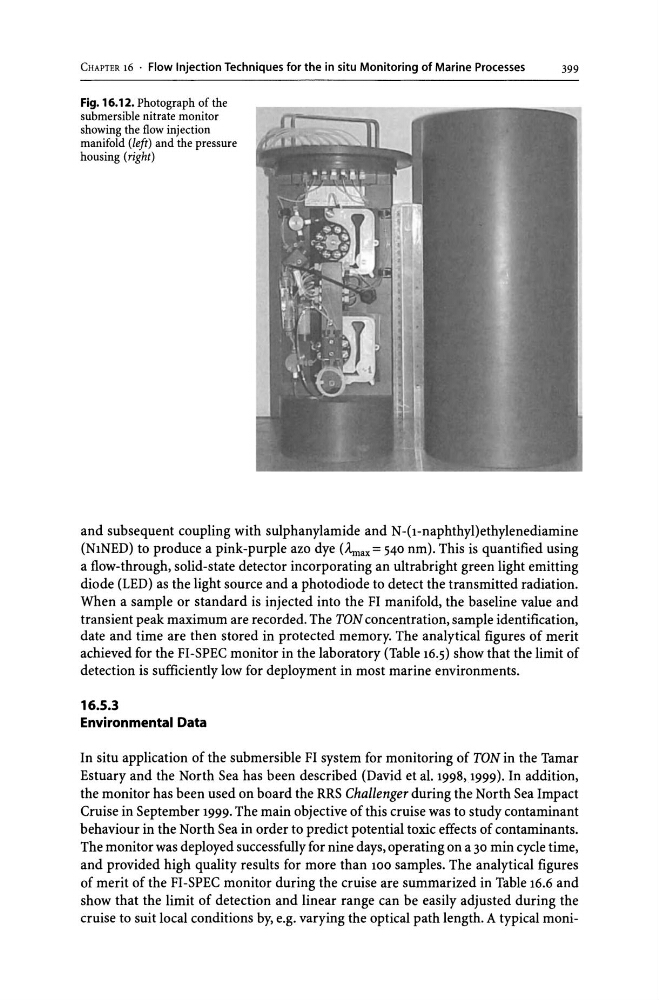
Fig. 16.12. Photograph of the
submersible nitrate monitor
showing the flow injection
manifold (left) and the pressure
housing (right)
and subsequent coupling with sulphanylamide and N-(l-naphthyl)ethylenediamine
(N1NED) to produce a pink-purple azo dye (Amax= 540 nm). This is quantified using
a flow-through, solid-state detector incorporating an ultrabright green light emitting
diode (LED) as the light source and a photo diode to detect the transmitted radiation.
When a sample or standard is injected into the FI manifold, the baseline value and
transient peak maximum are recorded. The TON concentration, sample identification,
date and time are then stored in protected memory. The analytical figures of merit
achieved for the FI-SPEC monitor in the laboratory (Table 16.5) show that the limit of
detection is sufficiently low for deployment in most marine environments.
16.5.3
Environmental Data
In situ application of the submersible FI system for monitoring of TON in the Tamar
Estuary and the North Sea has been described (David et al. 1998, 1999). In addition,
the monitor has been used on board the RRS Challenger during the North Sea Impact
Cruise in September 1999. The main objective of this cruise was to study contaminant
behaviour in the North Sea in order to predict potential toxic effects of contaminants.
The monitor was deployed successfully for nine days, operating on a 30 min cycle time,
and provided high quality results for more than 100 samples. The analytical figures
of merit of the FI-SPEC monitor during the cruise are summarized in Table 16.6 and
show that the limit of detection and linear range can be easily adjusted during the
cruise to suit local conditions by, e.g. varying the optical path length. A typical moni-
399
Fig. 16.12. Photograph of the
submersible nitrate monitor
showing the flow injection
manifold (left) and the pressure
housing (right)
and subsequent coupling with sulphanylamide and N-(l-naphthyl)ethylenediamine
(N1NED) to produce a pink-purple azo dye (Amax= 540 nm). This is quantified using
a flow-through, solid-state detector incorporating an ultrabright green light emitting
diode (LED) as the light source and a photo diode to detect the transmitted radiation.
When a sample or standard is injected into the FI manifold, the baseline value and
transient peak maximum are recorded. The TON concentration, sample identification,
date and time are then stored in protected memory. The analytical figures of merit
achieved for the FI-SPEC monitor in the laboratory (Table 16.5) show that the limit of
detection is sufficiently low for deployment in most marine environments.
16.5.3
Environmental Data
In situ application of the submersible FI system for monitoring of TON in the Tamar
Estuary and the North Sea has been described (David et al. 1998, 1999). In addition,
the monitor has been used on board the RRS Challenger during the North Sea Impact
Cruise in September 1999. The main objective of this cruise was to study contaminant
behaviour in the North Sea in order to predict potential toxic effects of contaminants.
The monitor was deployed successfully for nine days, operating on a 30 min cycle time,
and provided high quality results for more than 100 samples. The analytical figures
of merit of the FI-SPEC monitor during the cruise are summarized in Table 16.6 and
show that the limit of detection and linear range can be easily adjusted during the
cruise to suit local conditions by, e.g. varying the optical path length. A typical moni-