

CHAPTER 16 . Flow Injection Techniques for the in situ Monitoring of Marine Processes
397
Table 16.3. Analytical figures
of merit for the Co(II) FI-CL
manifold. The time for sample
quantification includes two
standard additions with analysis of each solution in triplicate
LOD
RSD (n = 5)
Linear Range
Time for one analytical cycle (n = 3)
Time for sample quantification
0.005 nM
<5%
0.005-1 nM (R 2 = 0.996S)
S min
26 min
Table 16.4. Laboratory based determination of Co in three marine certified reference materials and
an Irish Sea water sample. Error bars represent ±3 s
Sample
NASS-4
CASS-3
SLEW-2
Irish SW
0
20
]: 40
.r:. .... a.
CI)
60
c
SO
100
0
34.0
FI-CL (nMJ
0.16±0.01
0.60±0.09
0.93 ±0.13
0.35 ±0.02
100
34.2
Certified value (nM)
0.15 ±0.02
0.6S±0.11
0.S7 ±0.21
200
34.4
Co (pM)
300
Salinity
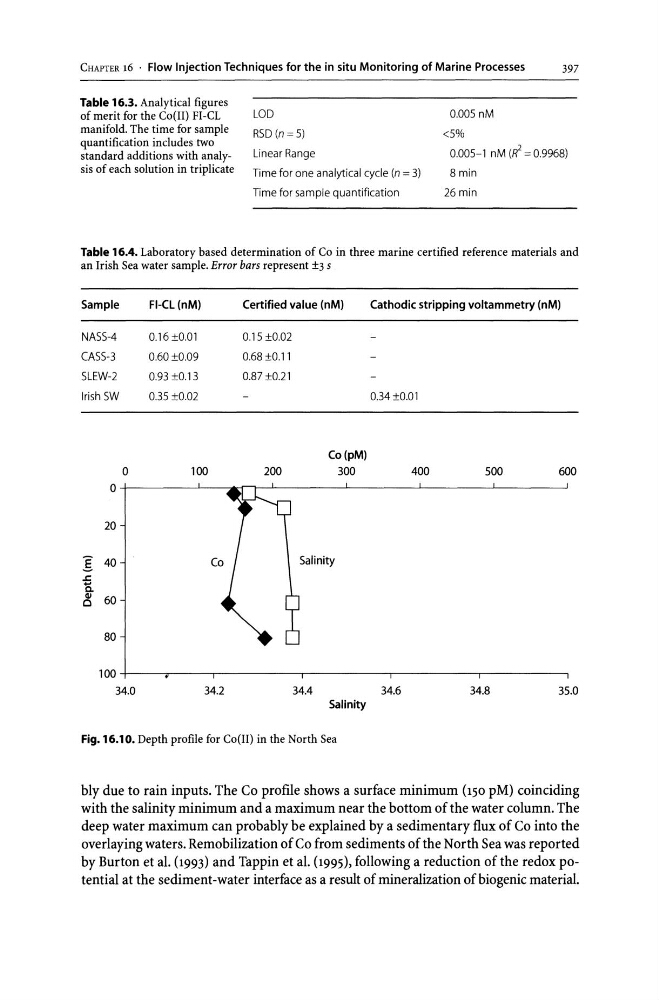
Fig. 16.10. Depth profile for Co (II) in the North Sea
Cathodic stripping voltammetry (nMJ
0.34 ±0.01
400
500
600
34.6
34.8
35.0
bly due to rain inputs. The Co profile shows a surface minimum (150 pM) coinciding
with the salinity minimum and a maximum near the bottom of the water column. The
deep water maximum can probably be explained by a sedimentary flux of Co into the
overlaying waters. Remobilization of Co from sediments of the North Sea was reported
by Burton et al. (1993) and Tappin et al. (1995), following a reduction of the redox potential at the sediment-water interface as a result of mineralization of biogenic material.
397
Table 16.3. Analytical figures
of merit for the Co(II) FI-CL
manifold. The time for sample
quantification includes two
standard additions with analysis of each solution in triplicate
LOD
RSD (n = 5)
Linear Range
Time for one analytical cycle (n = 3)
Time for sample quantification
0.005 nM
<5%
0.005-1 nM (R 2 = 0.996S)
S min
26 min
Table 16.4. Laboratory based determination of Co in three marine certified reference materials and
an Irish Sea water sample. Error bars represent ±3 s
Sample
NASS-4
CASS-3
SLEW-2
Irish SW
0
20
]: 40
.r:. .... a.
CI)
60
c
SO
100
0
34.0
FI-CL (nMJ
0.16±0.01
0.60±0.09
0.93 ±0.13
0.35 ±0.02
100
34.2
Certified value (nM)
0.15 ±0.02
0.6S±0.11
0.S7 ±0.21
200
34.4
Co (pM)
300
Salinity
Fig. 16.10. Depth profile for Co (II) in the North Sea
Cathodic stripping voltammetry (nMJ
0.34 ±0.01
400
500
600
34.6
34.8
35.0
bly due to rain inputs. The Co profile shows a surface minimum (150 pM) coinciding
with the salinity minimum and a maximum near the bottom of the water column. The
deep water maximum can probably be explained by a sedimentary flux of Co into the
overlaying waters. Remobilization of Co from sediments of the North Sea was reported
by Burton et al. (1993) and Tappin et al. (1995), following a reduction of the redox potential at the sediment-water interface as a result of mineralization of biogenic material.