

9.2 Field and Laboratory Measurement Techniques
aSO
'-'
,.Q
0. OJ
Cl
-5
-10
-15
-20
-20 -10 0 10 20
Velocity (cmls)
b]:O
£ p.,
OJ
Cl
-5
-10
-15
-20
NIS
-20 -10 0 10 20
Velocity (cm/s)
311
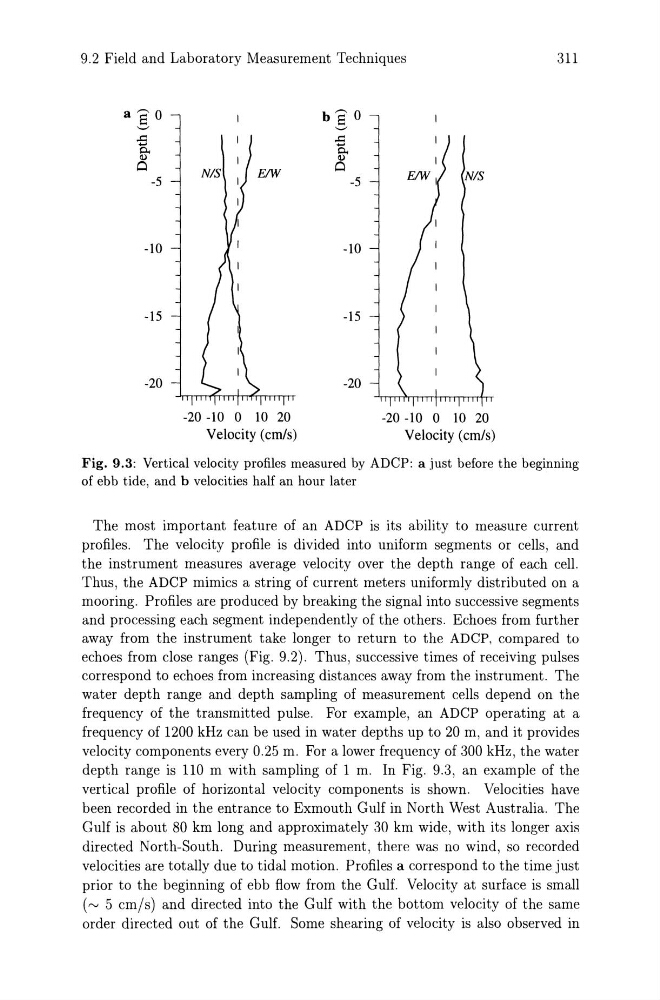
Fig. 9.3: Vertical velocity profiles measured by ADCP: a just before the beginning
of ebb tide, and b velocities half an hour later
The most important feature of an ADCP is its ability to measure current
profiles. The velocity profile is divided into uniform segments or cells, and
the instrument measures average velocity over the depth range of each cell.
Thus, the ADCP mimics a string of current meters uniformly distributed on a
mooring. Profiles are produced by breaking the signal into successive segments
and processing each segment independently of the others. Echoes from further
away from the instrument take longer to return to the ADCP. compared to
echoes from close ranges (Fig. 9.2). Thus, successive times of receiving pulses
correspond to echoes from increasing distances away from the instrument. The
water depth range and depth sampling of measurement cells depend on the
frequency of the transmitted pulse. For example, an ADCP operating at a
frequency of 1200 kHz can be used in water depths up to 20 m, and it provides
velocity components every 0.25 m. For a lower frequency of 300 kHz, the water
depth range is 110 m with sampling of 1 m. In Fig. 9.3, an example of the
vertical profile of horizontal velocity components is shown. Velocities have
been recorded in the entrance to Exmouth Gulf in North West Australia. The
Gulf is about 80 km long and approximately 30 km wide, with its longer axis
directed North-South. During measurement, there was no wind, so recorded
velocities are totally due to tidal motion. Profiles a correspond to the time just
prior to the beginning of ebb flow from the Gulf. Velocity at surface is small
('" 5 cm/s) and directed into the Gulf with the bottom velocity of the same
order directed out of the Gulf. Some shearing of velocity is also observed in
aSO
'-'
,.Q
0. OJ
Cl
-5
-10
-15
-20
-20 -10 0 10 20
Velocity (cmls)
b]:O
£ p.,
OJ
Cl
-5
-10
-15
-20
NIS
-20 -10 0 10 20
Velocity (cm/s)
311
Fig. 9.3: Vertical velocity profiles measured by ADCP: a just before the beginning
of ebb tide, and b velocities half an hour later
The most important feature of an ADCP is its ability to measure current
profiles. The velocity profile is divided into uniform segments or cells, and
the instrument measures average velocity over the depth range of each cell.
Thus, the ADCP mimics a string of current meters uniformly distributed on a
mooring. Profiles are produced by breaking the signal into successive segments
and processing each segment independently of the others. Echoes from further
away from the instrument take longer to return to the ADCP. compared to
echoes from close ranges (Fig. 9.2). Thus, successive times of receiving pulses
correspond to echoes from increasing distances away from the instrument. The
water depth range and depth sampling of measurement cells depend on the
frequency of the transmitted pulse. For example, an ADCP operating at a
frequency of 1200 kHz can be used in water depths up to 20 m, and it provides
velocity components every 0.25 m. For a lower frequency of 300 kHz, the water
depth range is 110 m with sampling of 1 m. In Fig. 9.3, an example of the
vertical profile of horizontal velocity components is shown. Velocities have
been recorded in the entrance to Exmouth Gulf in North West Australia. The
Gulf is about 80 km long and approximately 30 km wide, with its longer axis
directed North-South. During measurement, there was no wind, so recorded
velocities are totally due to tidal motion. Profiles a correspond to the time just
prior to the beginning of ebb flow from the Gulf. Velocity at surface is small
('" 5 cm/s) and directed into the Gulf with the bottom velocity of the same
order directed out of the Gulf. Some shearing of velocity is also observed in