

298
8 Transport in the Oceans and Coastal Zone
surJzone
incident
waves
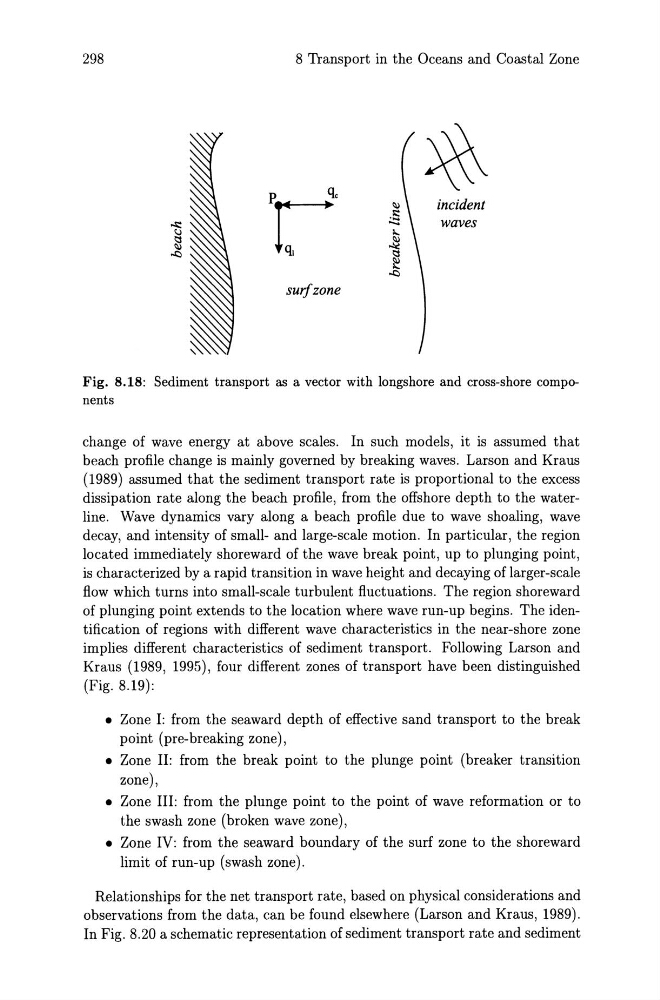
Fig. 8.18: Sediment transport as a vector with longshore and cross-shore components
change of wave energy at above scales. In such models, it is assumed that
beach profile change is mainly governed by breaking waves. Larson and Kraus
(1989) assumed that the sediment transport rate is proportional to the excess
dissipation rate along the beach profile, from the offshore depth to the waterline. Wave dynamics vary along a beach profile due to wave shoaling, wave
decay, and intensity of small- and large-scale motion. In particular, the region
located immediately shoreward of the wave break point, up to plunging point,
is characterized by a rapid transition in wave height and decaying of larger-scale
flow which turns into small-scale turbulent fluctuations. The region shoreward
of plunging point extends to the location where wave run-up begins. The identification of regions with different wave characteristics in the near-shore zone
implies different characteristics of sediment transport. Following Larson and
Kraus (1989, 1995), four different zones of transport have been distinguished
(Fig. 8.19):
• Zone I: from the seaward depth of effective sand transport to the break
point (pre-breaking zone),
• Zone II: from the break point to the plunge point (breaker transition
zone),
• Zone III: from the plunge point to the point of wave reformation or to
the swash zone (broken wave zone),
• Zone IV: from the seaward boundary of the surf zone to the shoreward
limit of run-up (swash zone).
Relationships for the net transport rate, based on physical considerations and
observations from the data, can be found elsewhere (Larson and Kraus, 1989).
In Fig. 8.20 a schematic representation of sediment transport rate and sediment
8 Transport in the Oceans and Coastal Zone
surJzone
incident
waves
Fig. 8.18: Sediment transport as a vector with longshore and cross-shore components
change of wave energy at above scales. In such models, it is assumed that
beach profile change is mainly governed by breaking waves. Larson and Kraus
(1989) assumed that the sediment transport rate is proportional to the excess
dissipation rate along the beach profile, from the offshore depth to the waterline. Wave dynamics vary along a beach profile due to wave shoaling, wave
decay, and intensity of small- and large-scale motion. In particular, the region
located immediately shoreward of the wave break point, up to plunging point,
is characterized by a rapid transition in wave height and decaying of larger-scale
flow which turns into small-scale turbulent fluctuations. The region shoreward
of plunging point extends to the location where wave run-up begins. The identification of regions with different wave characteristics in the near-shore zone
implies different characteristics of sediment transport. Following Larson and
Kraus (1989, 1995), four different zones of transport have been distinguished
(Fig. 8.19):
• Zone I: from the seaward depth of effective sand transport to the break
point (pre-breaking zone),
• Zone II: from the break point to the plunge point (breaker transition
zone),
• Zone III: from the plunge point to the point of wave reformation or to
the swash zone (broken wave zone),
• Zone IV: from the seaward boundary of the surf zone to the shoreward
limit of run-up (swash zone).
Relationships for the net transport rate, based on physical considerations and
observations from the data, can be found elsewhere (Larson and Kraus, 1989).
In Fig. 8.20 a schematic representation of sediment transport rate and sediment