

8.5 Diffusion and Mixing in Estuaries
Water velocity
o
~ _____ --1freshwater
~----------1~
...... -------1&
~----__1"1:3
zero velocity level
bottom
291
o
Water density
h
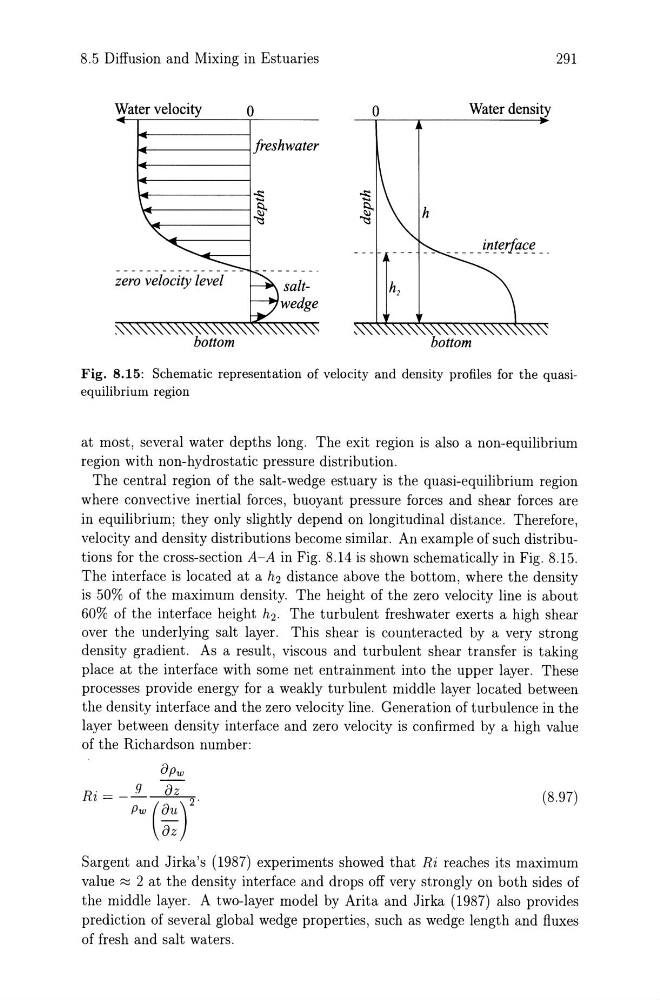
Fig. 8.15: Schematic representation of velocity and density profiles for the quasiequilibrium region
at most, several water depths long. The exit region is also a non-equilibrium
region with non-hydrostatic pressure distribution.
The central region of the salt-wedge estuary is the quasi-equilibrium region
where convective inertial forces, buoyant pressure forces and shear forces are
in equilibrium; they only slightly depend on longitudinal distance. Therefore,
velocity and density distributions become similar. An example of such distributions for the cross-section A-A in Fig. 8.14 is shown schematically in Fig. 8.15.
The interface is located at a h2 distance above the bottom, where the density
is 50% of the maximum density. The height of the zero velocity line is about
60% of the interface height h2. The turbulent freshwater exerts a high shear
over the underlying salt layer. This shear is counteracted by a very strong
density gradient. As a result, viscous and turbulent shear transfer is taking
place at the interface with some net entrainment into the upper layer. These
processes provide energy for a weakly turbulent middle layer located between
the density interface and the zero velocity line. Generation of turbulence in the
layer between density interface and zero velocity is confirmed by a high value
of the Richardson number:
0pw
Ri~ -:w d:r
(8.97)
Sargent and Jirka's (1987) experiments showed that Ri reaches its maximum
value ;::0 2 at the density interface and drops off very strongly on both sides of
the middle layer. A two-layer model by Arita and Jirka (1987) also provides
prediction of several global wedge properties, such as wedge length and fluxes
of fresh and salt waters.
Water velocity
o
~ _____ --1freshwater
~----------1~
...... -------1&
~----__1"1:3
zero velocity level
bottom
291
o
Water density
h
Fig. 8.15: Schematic representation of velocity and density profiles for the quasiequilibrium region
at most, several water depths long. The exit region is also a non-equilibrium
region with non-hydrostatic pressure distribution.
The central region of the salt-wedge estuary is the quasi-equilibrium region
where convective inertial forces, buoyant pressure forces and shear forces are
in equilibrium; they only slightly depend on longitudinal distance. Therefore,
velocity and density distributions become similar. An example of such distributions for the cross-section A-A in Fig. 8.14 is shown schematically in Fig. 8.15.
The interface is located at a h2 distance above the bottom, where the density
is 50% of the maximum density. The height of the zero velocity line is about
60% of the interface height h2. The turbulent freshwater exerts a high shear
over the underlying salt layer. This shear is counteracted by a very strong
density gradient. As a result, viscous and turbulent shear transfer is taking
place at the interface with some net entrainment into the upper layer. These
processes provide energy for a weakly turbulent middle layer located between
the density interface and the zero velocity line. Generation of turbulence in the
layer between density interface and zero velocity is confirmed by a high value
of the Richardson number:
0pw
Ri~ -:w d:r
(8.97)
Sargent and Jirka's (1987) experiments showed that Ri reaches its maximum
value ;::0 2 at the density interface and drops off very strongly on both sides of
the middle layer. A two-layer model by Arita and Jirka (1987) also provides
prediction of several global wedge properties, such as wedge length and fluxes
of fresh and salt waters.