

290
8 Transport in the Oceans and Coastal Zone
where P = Vp + Vr is the tidal prism and T is the period of the semidiurnal or
diurnal tide.
In general, we do not expect complete mixing during each tidal cycle for an
estuary, and some of the mixed water may return on each successive flood tide.
As a result, the calculated flushing time may be less than observed. More
rigorous tidal prism models have recently been reported by Luketina (1998).
8.5.3 Salt-Wedge Estuary
As we described in the Introduction (Sect. 8.5.1), salt-wedge estuaries are characterized by a small tidal range and by the absence of strong wind shear. Ocean
salt water intrudes upstream against the direction of the overlying freshwater
flow and a sharp interface separates the fresh and salt water layers. When the
river flow, water depth and salinity of ocean water remain constant, the advancing motion of the wedge eventually ceases. This ideal steady-state form is
known as an arrested saline wedge, when an equilibrium is maintained between
internal buoyant pressure gradients, interfacial shear stress and convective accelerations (Jirka, 1990; Partheniades, 1992).
The overall flow in a salt-wedge estuary is controlled by two non-dimensional
parameters: the channel densimetric Froude number Fa = Q f / V g~h3 and the
channel Reynolds number Re = Q f / l/, where Q f is the freshwater flow per unit
width, g~ = gt::.p/p (t::.p is the density difference) is the reduced gravity acceleration, h is the channel depth, and l/ is the coefficient of kinematic viscosity.
A salt-wedge estuary can exist when Fa < 1. In the absence of comprehensive
field data, most of the available information on the flow and density distribution is based on laboratory experiments. Using detailed laboratory experiments
by Sargent and Jirka (1987), a two-layer model for salt-wedge dynamics has
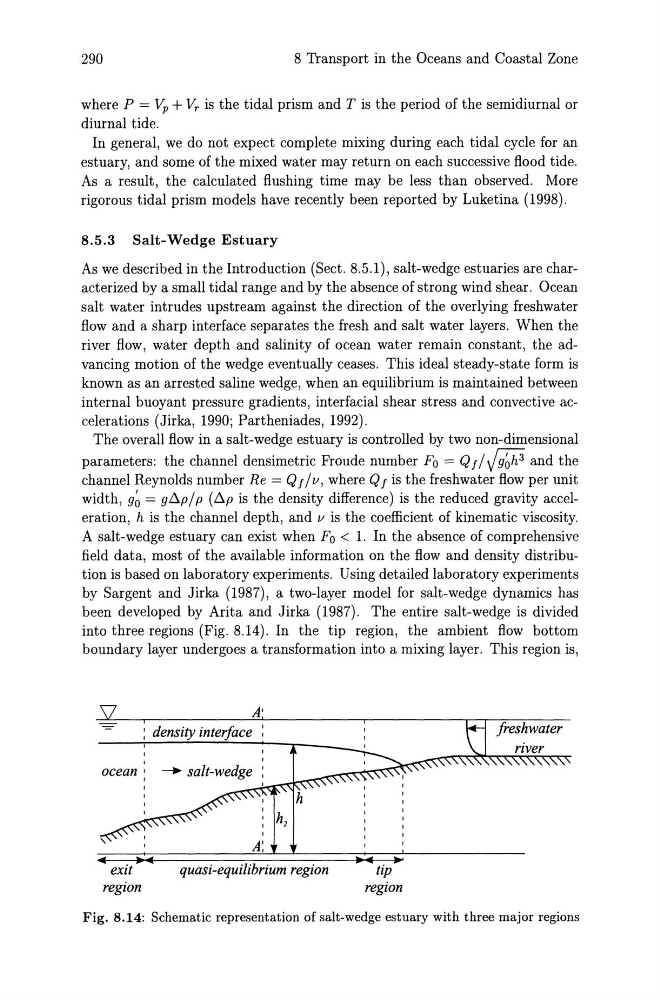
been developed by Arita and Jirka (1987). The entire salt-wedge is divided
into three regions (Fig. 8.14). In the tip region, the ambient flow bottom
boundary layer undergoes a transformation into a mixing layer. This region is,
A'
density interface '
ocean' ,
.. . ..
exit
region
quasi-equilibrium region
freshwater
... .'
tip
region
Fig. 8.14: Schematic representation of salt-wedge estuary with three major regions
8 Transport in the Oceans and Coastal Zone
where P = Vp + Vr is the tidal prism and T is the period of the semidiurnal or
diurnal tide.
In general, we do not expect complete mixing during each tidal cycle for an
estuary, and some of the mixed water may return on each successive flood tide.
As a result, the calculated flushing time may be less than observed. More
rigorous tidal prism models have recently been reported by Luketina (1998).
8.5.3 Salt-Wedge Estuary
As we described in the Introduction (Sect. 8.5.1), salt-wedge estuaries are characterized by a small tidal range and by the absence of strong wind shear. Ocean
salt water intrudes upstream against the direction of the overlying freshwater
flow and a sharp interface separates the fresh and salt water layers. When the
river flow, water depth and salinity of ocean water remain constant, the advancing motion of the wedge eventually ceases. This ideal steady-state form is
known as an arrested saline wedge, when an equilibrium is maintained between
internal buoyant pressure gradients, interfacial shear stress and convective accelerations (Jirka, 1990; Partheniades, 1992).
The overall flow in a salt-wedge estuary is controlled by two non-dimensional
parameters: the channel densimetric Froude number Fa = Q f / V g~h3 and the
channel Reynolds number Re = Q f / l/, where Q f is the freshwater flow per unit
width, g~ = gt::.p/p (t::.p is the density difference) is the reduced gravity acceleration, h is the channel depth, and l/ is the coefficient of kinematic viscosity.
A salt-wedge estuary can exist when Fa < 1. In the absence of comprehensive
field data, most of the available information on the flow and density distribution is based on laboratory experiments. Using detailed laboratory experiments
by Sargent and Jirka (1987), a two-layer model for salt-wedge dynamics has
been developed by Arita and Jirka (1987). The entire salt-wedge is divided
into three regions (Fig. 8.14). In the tip region, the ambient flow bottom
boundary layer undergoes a transformation into a mixing layer. This region is,
A'
density interface '
ocean' ,
.. . ..
exit
region
quasi-equilibrium region
freshwater
... .'
tip
region
Fig. 8.14: Schematic representation of salt-wedge estuary with three major regions