

8.5 Diffusion and Mixing in Estuaries
289
where 0: f is the average freshwater fraction and Ve is the entire volume of the
estuary. Using Eq. (8.90) and (8.92) we obtain the flushing time as:
(8.93)
Tidal Prism Method. Tidal prism models have been used for estuary studies
for a considerable period of time. In tidal models, an estuary is represented
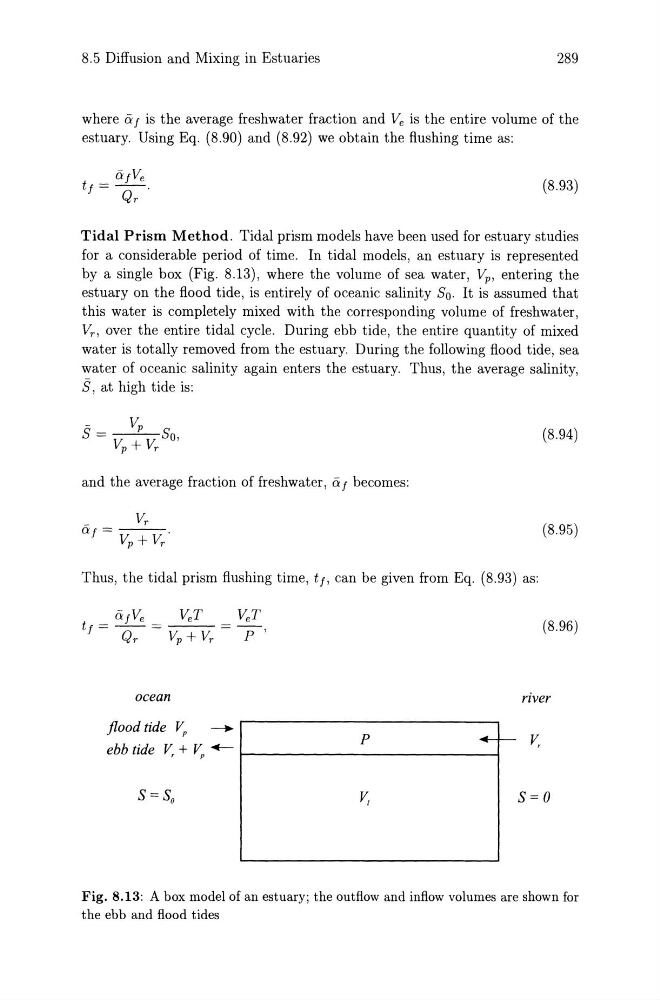
by a single box (Fig. 8.13), where the volume of sea water, Vp , entering the
estuary on the flood tide, is entirely of oceanic salinity So. It is assumed that
this water is completely mixed with the corresponding volume of freshwater,
VT) over the entire tidal cycle. During ebb tide, the entire quantity of mixed
water is totally removed from the estuary. During the following flood tide, sea
water of oceanic salinity again enters the estuary. Thus, the average salinity,
S, at high tide is:
-
Vp
S = 1/ 1/ So,
p + r
(8.94)
and the average fraction of freshwater, O:f becomes:
(8.95 )
Thus, the tidal prism flushing time, tf, can be given from Eq. (8.93) as:
O:.fVe
VeT
VeT
tf = ~ = Vp + Vr
p'
(8.96)
ocean
river
flood tide Vp
--.
P
+-r- V,
ebb tide V, + ~ +-- 1 - - - - - - - - - - - - - - - - 1
s=o
Fig. 8.13: A box model of an estuary; the outflow and inflow volumes are shown for
the ebb and flood tides
289
where 0: f is the average freshwater fraction and Ve is the entire volume of the
estuary. Using Eq. (8.90) and (8.92) we obtain the flushing time as:
(8.93)
Tidal Prism Method. Tidal prism models have been used for estuary studies
for a considerable period of time. In tidal models, an estuary is represented
by a single box (Fig. 8.13), where the volume of sea water, Vp , entering the
estuary on the flood tide, is entirely of oceanic salinity So. It is assumed that
this water is completely mixed with the corresponding volume of freshwater,
VT) over the entire tidal cycle. During ebb tide, the entire quantity of mixed
water is totally removed from the estuary. During the following flood tide, sea
water of oceanic salinity again enters the estuary. Thus, the average salinity,
S, at high tide is:
-
Vp
S = 1/ 1/ So,
p + r
(8.94)
and the average fraction of freshwater, O:f becomes:
(8.95 )
Thus, the tidal prism flushing time, tf, can be given from Eq. (8.93) as:
O:.fVe
VeT
VeT
tf = ~ = Vp + Vr
p'
(8.96)
ocean
river
flood tide Vp
--.
P
+-r- V,
ebb tide V, + ~ +-- 1 - - - - - - - - - - - - - - - - 1
s=o
Fig. 8.13: A box model of an estuary; the outflow and inflow volumes are shown for
the ebb and flood tides