

248
7 Ocean Currents
: breaker point
still water level
- - - - - - - - - --""",",,~
set-down
position of waterline)
I'
outofstorm
position of waterline
during storm
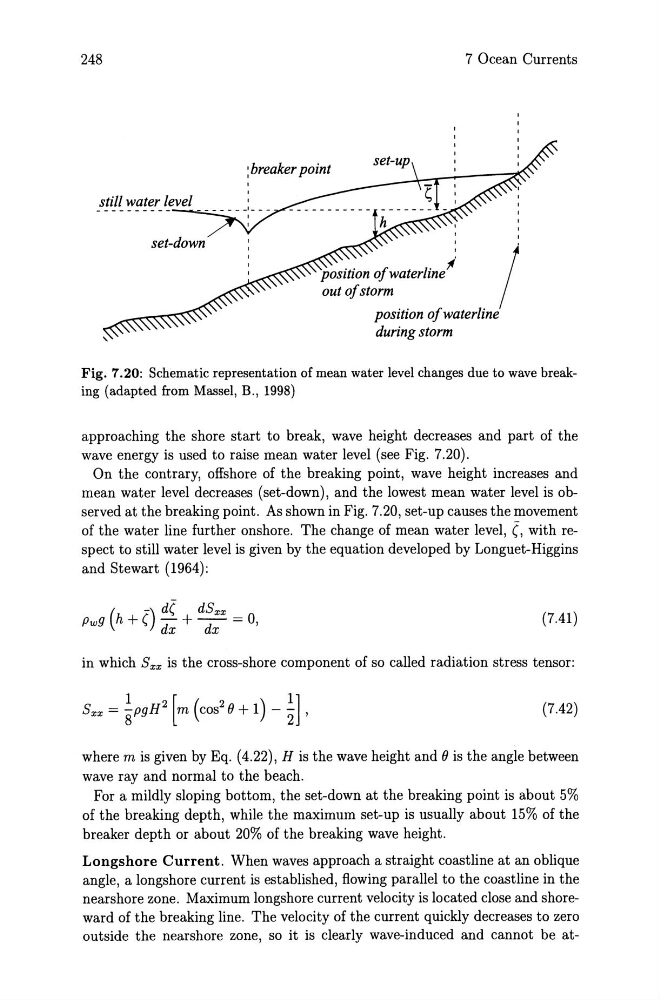
Fig. 7.20: Schematic representation of mean water level changes due to wave breaking (adapted from Massel, B., 1998)
approaching the shore start to break, wave height decreases and part of the
wave energy is used to raise mean water level (see Fig. 7.20).
On the contrary, offshore of the breaking point, wave height increases and
mean water level decreases (set-down), and the lowest mean water level is observed at the breaking point. As shown in Fig. 7.20, set-up causes the movement
of the water line further onshore. The change of mean water level, (, with respect to still water level is given by the equation developed by Longuet-Higgins
and Stewart (1964):
(
-) d(
dSxx
Pwg h + ( dx + ---;J;- = 0,
(7.41)
in which Sxx is the cross-shore component of so called radiation stress tensor:
(7.42)
where m is given by Eq. (4.22), H is the wave height and () is the angle between
wave ray and normal to the beach.
For a mildly sloping bottom, the set-down at the breaking point is about 5%
of the breaking depth, while the maximum set-up is usually about 15% of the
breaker depth or about 20% of the breaking wave height.
Longshore Current. When waves approach a straight coastline at an oblique
angle, a longshore current is established, flowing parallel to the coastline in the
nearshore zone. Maximum longshore current velocity is located close and shoreward of the breaking line. The velocity of the current quickly decreases to zero
outside the nearshore zone, so it is clearly wave-induced and cannot be at-
7 Ocean Currents
: breaker point
still water level
- - - - - - - - - --""",",,~
set-down
position of waterline)
I'
outofstorm
position of waterline
during storm
Fig. 7.20: Schematic representation of mean water level changes due to wave breaking (adapted from Massel, B., 1998)
approaching the shore start to break, wave height decreases and part of the
wave energy is used to raise mean water level (see Fig. 7.20).
On the contrary, offshore of the breaking point, wave height increases and
mean water level decreases (set-down), and the lowest mean water level is observed at the breaking point. As shown in Fig. 7.20, set-up causes the movement
of the water line further onshore. The change of mean water level, (, with respect to still water level is given by the equation developed by Longuet-Higgins
and Stewart (1964):
(
-) d(
dSxx
Pwg h + ( dx + ---;J;- = 0,
(7.41)
in which Sxx is the cross-shore component of so called radiation stress tensor:
(7.42)
where m is given by Eq. (4.22), H is the wave height and () is the angle between
wave ray and normal to the beach.
For a mildly sloping bottom, the set-down at the breaking point is about 5%
of the breaking depth, while the maximum set-up is usually about 15% of the
breaker depth or about 20% of the breaking wave height.
Longshore Current. When waves approach a straight coastline at an oblique
angle, a longshore current is established, flowing parallel to the coastline in the
nearshore zone. Maximum longshore current velocity is located close and shoreward of the breaking line. The velocity of the current quickly decreases to zero
outside the nearshore zone, so it is clearly wave-induced and cannot be at-