

7.8 Coastal Water Movement
249
a'-" 0.6
'-'
•
expo data (Thornton and Guza, 1986)
;;.-. 0.5
....
'0
numerical model
0
Q) 0.4
•
>
....
•
s:: 0.3
~
;::s
u
0.2
e
...
0
J.l
..c 0.1
I
~ ~
I:lO
... s:::
s:: 0.0
...t:);":':
0
....:l
b
,-.,
0
S
'-'
..c .... 0- Q)
"0
.... -1
Q)
~
~
-2
-3
o
10
20
30
40
50
60
70
Distance (m)
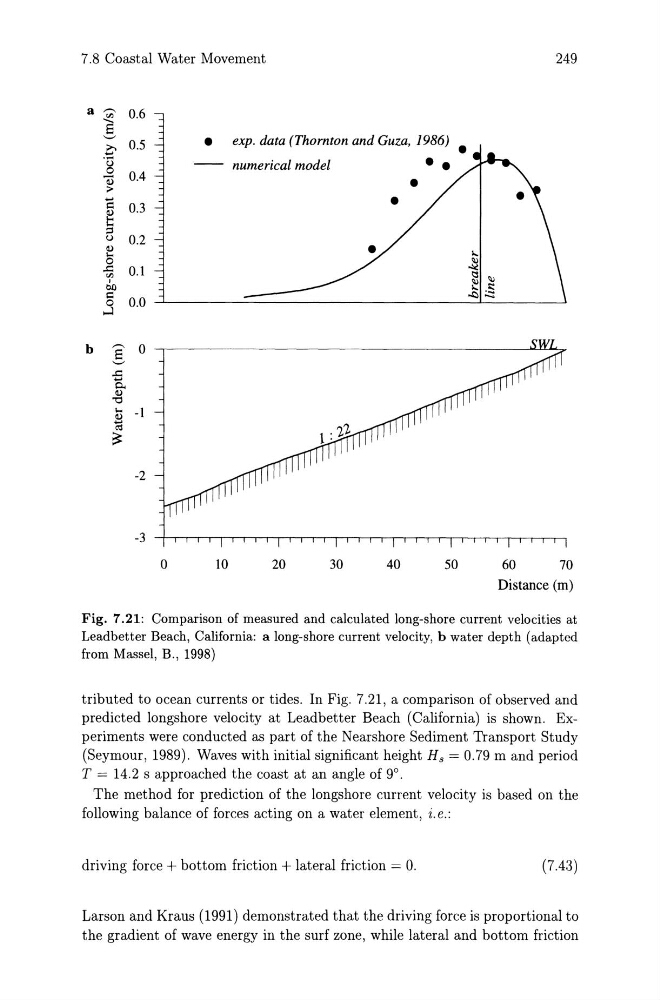
Fig. 7.21: Comparison of measured and calculated long-shore current velocities at
Leadbetter Beach, California: a long-shore current velocity, b water depth (adapted
from Massel, B., 1998)
tributed to ocean currents or tides. In Fig. 7.21, a comparison of observed and
predicted longshore velocity at Leadbetter Beach (California) is shown. Experiments were conducted as part of the Nearshore Sediment Transport Study
(Seymour, 1989). Waves with initial significant height Hs = 0.79 m and period
T = 14.2 s approached the coast at an angle of 9°.
The method for prediction of the longshore current velocity is based on the
following balance of forces acting on a water element, i.e.:
driving force + bottom friction + lateral friction = O.
(7.43)
Larson and Kraus (1991) demonstrated that the driving force is proportional to
the gradient of wave energy in the surf zone, while lateral and bottom friction
249
a'-" 0.6
'-'
•
expo data (Thornton and Guza, 1986)
;;.-. 0.5
....
'0
numerical model
0
Q) 0.4
•
>
....
•
s:: 0.3
~
;::s
u
0.2
e
...
0
J.l
..c 0.1
I
~ ~
I:lO
... s:::
s:: 0.0
...t:);":':
0
....:l
b
,-.,
0
S
'-'
..c .... 0- Q)
"0
.... -1
Q)
~
~
-2
-3
o
10
20
30
40
50
60
70
Distance (m)
Fig. 7.21: Comparison of measured and calculated long-shore current velocities at
Leadbetter Beach, California: a long-shore current velocity, b water depth (adapted
from Massel, B., 1998)
tributed to ocean currents or tides. In Fig. 7.21, a comparison of observed and
predicted longshore velocity at Leadbetter Beach (California) is shown. Experiments were conducted as part of the Nearshore Sediment Transport Study
(Seymour, 1989). Waves with initial significant height Hs = 0.79 m and period
T = 14.2 s approached the coast at an angle of 9°.
The method for prediction of the longshore current velocity is based on the
following balance of forces acting on a water element, i.e.:
driving force + bottom friction + lateral friction = O.
(7.43)
Larson and Kraus (1991) demonstrated that the driving force is proportional to
the gradient of wave energy in the surf zone, while lateral and bottom friction