

180
]:4
.E 3
01)
.~ 2
:::c: 1
o
full diurnal type F = 18.9
Do-San (Vietnam)
mixed, dominant semi-diurnal type F = 0.90
S 2 San Francisco (USA)
'-'
.§d
.~
:::c: 0
-1
mixed, dominant diurnal type F = 2.15
]: oIl Manila (Philippines)
i
.~
:::c:
5. Tides
I
I
I
I
I
I
I
I
I
I
I
I
I
I
I
I
o 2 4 6 8 10 12 14 16 18 20 22 24 26 28 30
Days
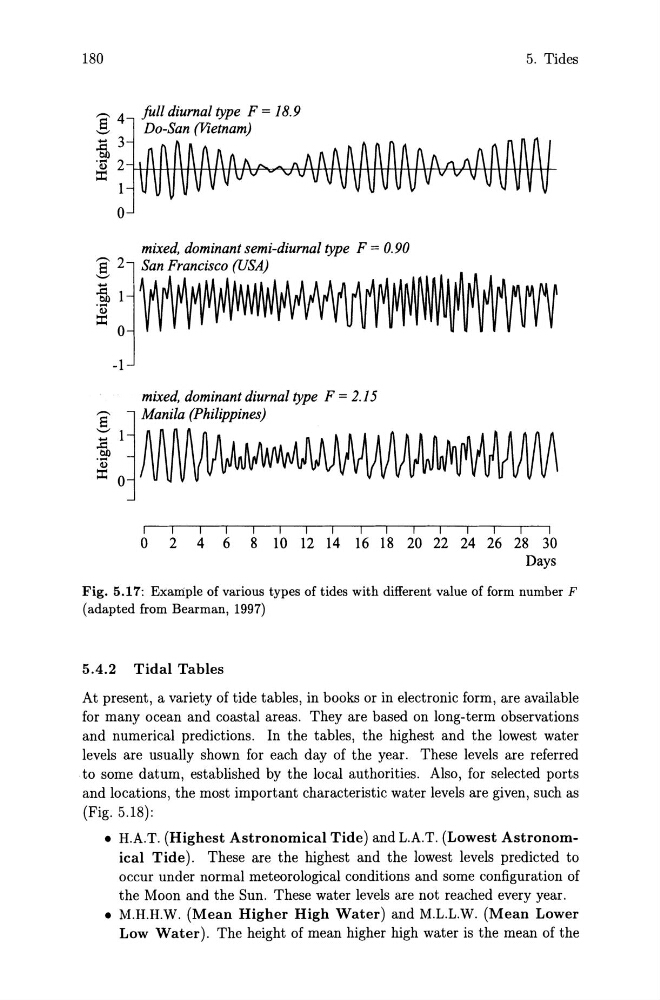
Fig. 5.17: Example of various types of tides with different value of form number F
(adapted from Bearman, 1997)
5.4.2 Tidal Tables
At present, a variety of tide tables, in books or in electronic form, are available
for many ocean and coastal areas. They are based on long-term observations
and numerical predictions. In the tables, the highest and the lowest water
levels are usually shown for each day of the year. These levels are referred
to some datum, established by the local authorities. Also, for selected ports
and locations, the most important characteristic water levels are given, such as
(Fig. 5.18):
• H.A.T. (Highest Astronomical Tide) and L.A.T. (Lowest Astronomical Tide). These are the highest and the lowest levels predicted to
occur under normal meteorological conditions and some configuration of
the Moon and the Sun. These water levels are not reached every year .
• M.H.H.W. (Mean Higher High Water) and M.L.L.W. (Mean Lower
Low Water). The height of mean higher high water is the mean of the
]:4
.E 3
01)
.~ 2
:::c: 1
o
full diurnal type F = 18.9
Do-San (Vietnam)
mixed, dominant semi-diurnal type F = 0.90
S 2 San Francisco (USA)
'-'
.§d
.~
:::c: 0
-1
mixed, dominant diurnal type F = 2.15
]: oIl Manila (Philippines)
i
.~
:::c:
5. Tides
I
I
I
I
I
I
I
I
I
I
I
I
I
I
I
I
o 2 4 6 8 10 12 14 16 18 20 22 24 26 28 30
Days
Fig. 5.17: Example of various types of tides with different value of form number F
(adapted from Bearman, 1997)
5.4.2 Tidal Tables
At present, a variety of tide tables, in books or in electronic form, are available
for many ocean and coastal areas. They are based on long-term observations
and numerical predictions. In the tables, the highest and the lowest water
levels are usually shown for each day of the year. These levels are referred
to some datum, established by the local authorities. Also, for selected ports
and locations, the most important characteristic water levels are given, such as
(Fig. 5.18):
• H.A.T. (Highest Astronomical Tide) and L.A.T. (Lowest Astronomical Tide). These are the highest and the lowest levels predicted to
occur under normal meteorological conditions and some configuration of
the Moon and the Sun. These water levels are not reached every year .
• M.H.H.W. (Mean Higher High Water) and M.L.L.W. (Mean Lower
Low Water). The height of mean higher high water is the mean of the