

150
4 How to Determine Wave Parameters
in which wave numbers, kn, are related to wave frequencies, W n, by Eq. (4.3)
and tn are the phase angles from the range (0, 271" ). The resemblance of representation (4.100) to representation (4.96) becomes clear if we assume x = y = 0
and neglect the offset ao. However, there is a fundamental difference between
both representations. In contrast to Eq. (4.96), the amplitudes Cn and phases
tn in Eq. (4.100) are random functions. The wave amplitudes, Cn, obey some
probability density distribution, like that given by Eq. (4.87). For the phase,
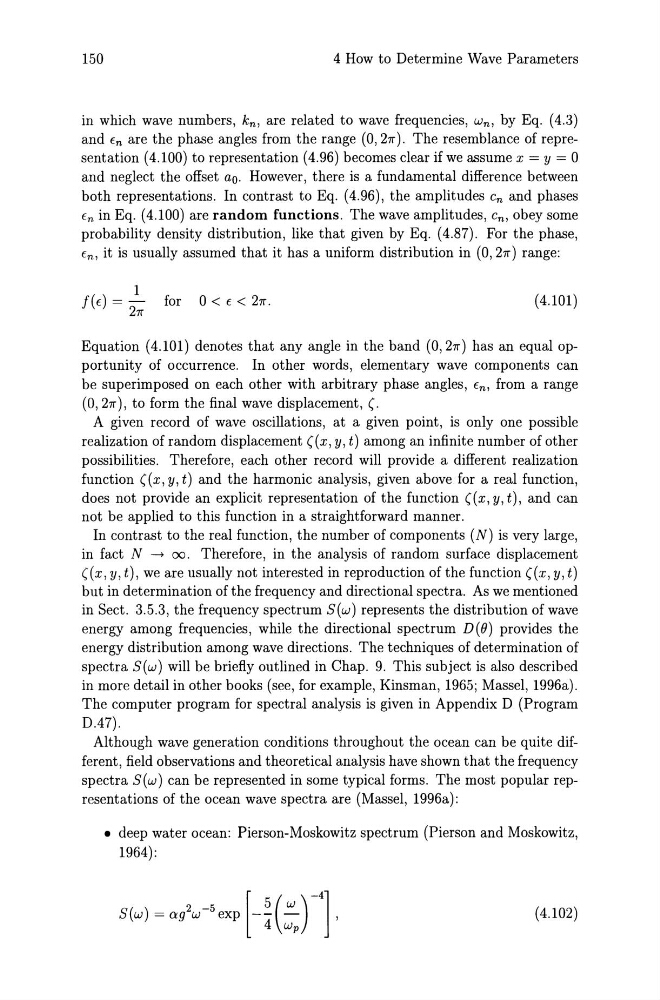
tn, it is usually assumed that it has a uniform distribution in (0,271") range:
1
f (t) = -
for 0 < t < 271".
271"
(4.101)
Equation (4.101) denotes that any angle in the band (0,271") has an equal opportunity of occurrence. In other words, elementary wave components can
be superimposed on each other with arbitrary phase angles, tn, from a range
(0,271"), to form the final wave displacement, (.
A given record of wave oscillations, at a given point, is only one possible
realization of random displacement ((x, y, t) among an infinite number of other
possibilities. Therefore, each other record will provide a different realization
function ((x, y, t) and the harmonic analysis, given above for a real function,
does not provide an explicit representation of the function ((x, y, t), and can
not be applied to this function in a straightforward manner.
In contrast to the real function, the number of components (N) is very large,
in fact N ~ 00. Therefore, in the analysis of random surface displacement
((x, y, t), we are usually not interested in reproduction of the function ((x, y, t)
but in determination of the frequency and directional spectra. As we mentioned
in Sect. 3.5.3, the frequency spectrum S(w) represents the distribution of wave
energy among frequencies, while the directional spectrum D(B) provides the
energy distribution among wave directions. The techniques of determination of
spectra S(w) will be briefly outlined in Chap. 9. This subject is also described
in more detail in other books (see, for example, Kinsman, 1965; Massel, 1996a).
The computer program for spectral analysis is given in Appendix D (Program
D.47).
Although wave generation conditions throughout the ocean can be quite different, field observations and theoretical analysis have shown that the frequency
spectra S(w) can be represented in some typical forms. The most popular representations of the ocean wave spectra are (Massel, 1996a):
• deep water ocean: Pierson-Moskowitz spectrum (Pierson and Moskowitz,
1964):
(4.102)
4 How to Determine Wave Parameters
in which wave numbers, kn, are related to wave frequencies, W n, by Eq. (4.3)
and tn are the phase angles from the range (0, 271" ). The resemblance of representation (4.100) to representation (4.96) becomes clear if we assume x = y = 0
and neglect the offset ao. However, there is a fundamental difference between
both representations. In contrast to Eq. (4.96), the amplitudes Cn and phases
tn in Eq. (4.100) are random functions. The wave amplitudes, Cn, obey some
probability density distribution, like that given by Eq. (4.87). For the phase,
tn, it is usually assumed that it has a uniform distribution in (0,271") range:
1
f (t) = -
for 0 < t < 271".
271"
(4.101)
Equation (4.101) denotes that any angle in the band (0,271") has an equal opportunity of occurrence. In other words, elementary wave components can
be superimposed on each other with arbitrary phase angles, tn, from a range
(0,271"), to form the final wave displacement, (.
A given record of wave oscillations, at a given point, is only one possible
realization of random displacement ((x, y, t) among an infinite number of other
possibilities. Therefore, each other record will provide a different realization
function ((x, y, t) and the harmonic analysis, given above for a real function,
does not provide an explicit representation of the function ((x, y, t), and can
not be applied to this function in a straightforward manner.
In contrast to the real function, the number of components (N) is very large,
in fact N ~ 00. Therefore, in the analysis of random surface displacement
((x, y, t), we are usually not interested in reproduction of the function ((x, y, t)
but in determination of the frequency and directional spectra. As we mentioned
in Sect. 3.5.3, the frequency spectrum S(w) represents the distribution of wave
energy among frequencies, while the directional spectrum D(B) provides the
energy distribution among wave directions. The techniques of determination of
spectra S(w) will be briefly outlined in Chap. 9. This subject is also described
in more detail in other books (see, for example, Kinsman, 1965; Massel, 1996a).
The computer program for spectral analysis is given in Appendix D (Program
D.47).
Although wave generation conditions throughout the ocean can be quite different, field observations and theoretical analysis have shown that the frequency
spectra S(w) can be represented in some typical forms. The most popular representations of the ocean wave spectra are (Massel, 1996a):
• deep water ocean: Pierson-Moskowitz spectrum (Pierson and Moskowitz,
1964):
(4.102)