

53
Chapter three: Exercise energetics
reached (Taylor et al. 1982). In contrast, the
VO 2 of phocid seals (Davis et al. 1985; Fedak 1986),
sea lions (Feldkamp 1987), dolphins (Williams et al. 1992), and killer whales (Kreite 1994)
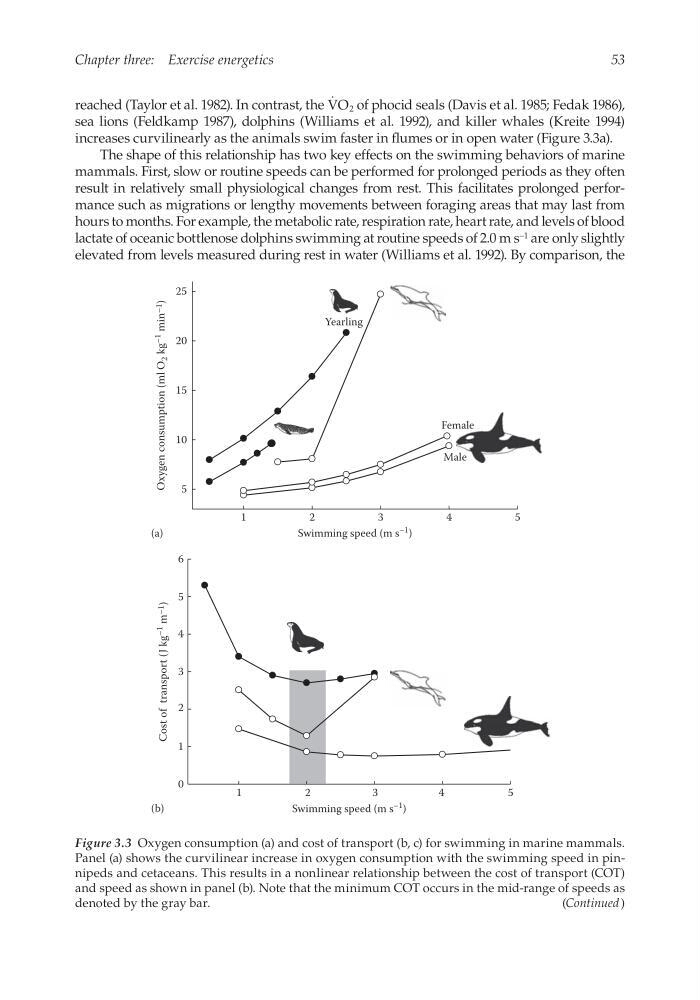
increases curvilinearly as the animals swim faster in flumes or in open water (Figure 3.3a).
The shape of this relationship has two key effects on the swimming behaviors of marine
mammals. First, slow or routine speeds can be performed for prolonged periods as they often
result in relatively small physiological changes from rest. This facilitates prolonged performance such as migrations or lengthy movements between foraging areas that may last from
hours to months. For example, the metabolic rate, respiration rate, heart rate, and levels of blood
lactate of oceanic bottlenose dolphins swimming at routine speeds of 2.0 m s −1 are only slightly
elevated from levels measured during rest in water (Williams et al. 1992). By comparison, the
6
5
4
3
2
1
0
(b)
1
2
3
4
5
Cost of transport (J kg
–1
m –1
)
Swimming speed (m s
–1 )
25
(a)
20
15
10
5
1
Oxygen consumption (ml O
2 kg
–1
min –1
)
2
3
Swimming speed (m s –1 )
4
5
Yearling
Female
Male
Figure 3.3 Oxygen consumption (a) and cost of transport (b, c) for swimming in marine mammals.
Panel (a) shows the curvilinear increase in oxygen consumption with the swimming speed in pinnipeds and cetaceans. This results in a nonlinear relationship between the cost of transport (COT)
and speed as shown in panel (b). Note that the minimum COT occurs in the mid-range of speeds as
denoted by the gray bar.
(Continued )
Chapter three: Exercise energetics
reached (Taylor et al. 1982). In contrast, the
VO 2 of phocid seals (Davis et al. 1985; Fedak 1986),
sea lions (Feldkamp 1987), dolphins (Williams et al. 1992), and killer whales (Kreite 1994)
increases curvilinearly as the animals swim faster in flumes or in open water (Figure 3.3a).
The shape of this relationship has two key effects on the swimming behaviors of marine
mammals. First, slow or routine speeds can be performed for prolonged periods as they often
result in relatively small physiological changes from rest. This facilitates prolonged performance such as migrations or lengthy movements between foraging areas that may last from
hours to months. For example, the metabolic rate, respiration rate, heart rate, and levels of blood
lactate of oceanic bottlenose dolphins swimming at routine speeds of 2.0 m s −1 are only slightly
elevated from levels measured during rest in water (Williams et al. 1992). By comparison, the
6
5
4
3
2
1
0
(b)
1
2
3
4
5
Cost of transport (J kg
–1
m –1
)
Swimming speed (m s
–1 )
25
(a)
20
15
10
5
1
Oxygen consumption (ml O
2 kg
–1
min –1
)
2
3
Swimming speed (m s –1 )
4
5
Yearling
Female
Male
Figure 3.3 Oxygen consumption (a) and cost of transport (b, c) for swimming in marine mammals.
Panel (a) shows the curvilinear increase in oxygen consumption with the swimming speed in pinnipeds and cetaceans. This results in a nonlinear relationship between the cost of transport (COT)
and speed as shown in panel (b). Note that the minimum COT occurs in the mid-range of speeds as
denoted by the gray bar.
(Continued )