

5.7 Two Spatial Dimensions
285
(a) : : : : : : : : : : : : : : : : : : : : .
: .... . , - - _ ..... .- .- .. -- _. .. -- .. ... :
y
.. .. . . . . . . . . . . . . . . ..
. . . .
..
X
o
1
•
•
I
,
/
/
" . . " .... _
. - . .
_
_
(b)
0
X
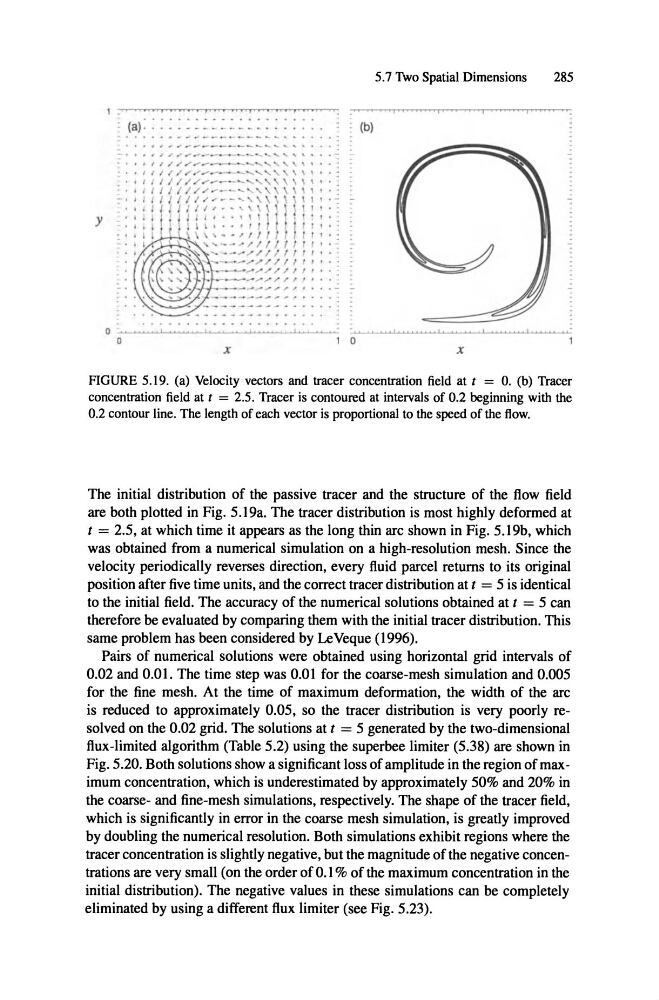
FIGURE 5.19. (a) Velocity vectors and tracer concentration field at t = O. (b) Tracer
concentration field at t = 2.5. Tracer is contoured at intervals of 0.2 beginning with the
0.2 contour line, Tbc length of each vector is proportional to the speed of the flow,
The initial distribution of the passive tracer and the structure of the flow field
are both plotted in Fig. 5.19a. The tracer distribution is most highly deformed at
t = 2.5, at which time it appears as the long thin arc shown in Fig. 5.19b, which
was obtained from a numerical simulation on a high-resolution mesh. Since the
velocity periodically reverses direction, every fluid parcel returns to its original
position after five time units, and the correct tracer distribution at t = 5 is identical
to the initial field. The accuracy of the numerical solutions obtained at t = 5 can
therefore be evaluated by comparing them with the initial tracer distribution. This
same problem has been considered by LeVeque (1996).
Pairs of numerical solutions were obtained using horizontal grid intervals of
0.02 and 0.01. The time step was 0.01 for the coarse-mesh simulation and 0.005
for the fine mesh. At the time of maximum deformation, the width of the arc
is reduced to approximately 0.05, so the tracer distribution is very poorly resolved on the 0.02 grid . The solutions at t = 5 generated by the two-dimensional
flux-limited algorithm (Table 5.2) using the superbee Iimiter (5.38) are shown in
Fig. 5.20. Both solutions show a significant loss of amplitude in the region of maximum concentration, which is underestimated by approximately 50% and 20% in
the coarse- and fine-mesh simulations, respectively. The shape of the tracer field,
which is significantly in error in the coarse mesh simulation, is greatly improved
by doubling the numerical resolution. Both simulations exhibit regions where the
tracer concentration is slightly negative, but the magnitude of the negative concentrations are very small (on the order of 0.1% of the maximum concentration in the
initial distribution). The negative values in these simulations can be completely
eliminated by using a different flux limiter (see Fig. 5.23).
285
(a) : : : : : : : : : : : : : : : : : : : : .
: .... . , - - _ ..... .- .- .. -- _. .. -- .. ... :
y
.. .. . . . . . . . . . . . . . . ..
. . . .
..
X
o
1
•
•
I
,
/
/
" . . " .... _
. - . .
_
_
(b)
0
X
FIGURE 5.19. (a) Velocity vectors and tracer concentration field at t = O. (b) Tracer
concentration field at t = 2.5. Tracer is contoured at intervals of 0.2 beginning with the
0.2 contour line, Tbc length of each vector is proportional to the speed of the flow,
The initial distribution of the passive tracer and the structure of the flow field
are both plotted in Fig. 5.19a. The tracer distribution is most highly deformed at
t = 2.5, at which time it appears as the long thin arc shown in Fig. 5.19b, which
was obtained from a numerical simulation on a high-resolution mesh. Since the
velocity periodically reverses direction, every fluid parcel returns to its original
position after five time units, and the correct tracer distribution at t = 5 is identical
to the initial field. The accuracy of the numerical solutions obtained at t = 5 can
therefore be evaluated by comparing them with the initial tracer distribution. This
same problem has been considered by LeVeque (1996).
Pairs of numerical solutions were obtained using horizontal grid intervals of
0.02 and 0.01. The time step was 0.01 for the coarse-mesh simulation and 0.005
for the fine mesh. At the time of maximum deformation, the width of the arc
is reduced to approximately 0.05, so the tracer distribution is very poorly resolved on the 0.02 grid . The solutions at t = 5 generated by the two-dimensional
flux-limited algorithm (Table 5.2) using the superbee Iimiter (5.38) are shown in
Fig. 5.20. Both solutions show a significant loss of amplitude in the region of maximum concentration, which is underestimated by approximately 50% and 20% in
the coarse- and fine-mesh simulations, respectively. The shape of the tracer field,
which is significantly in error in the coarse mesh simulation, is greatly improved
by doubling the numerical resolution. Both simulations exhibit regions where the
tracer concentration is slightly negative, but the magnitude of the negative concentrations are very small (on the order of 0.1% of the maximum concentration in the
initial distribution). The negative values in these simulations can be completely
eliminated by using a different flux limiter (see Fig. 5.23).