

522
J. Ojeda Zújar et al.
Volumetric Spatial Changes 1989-1994
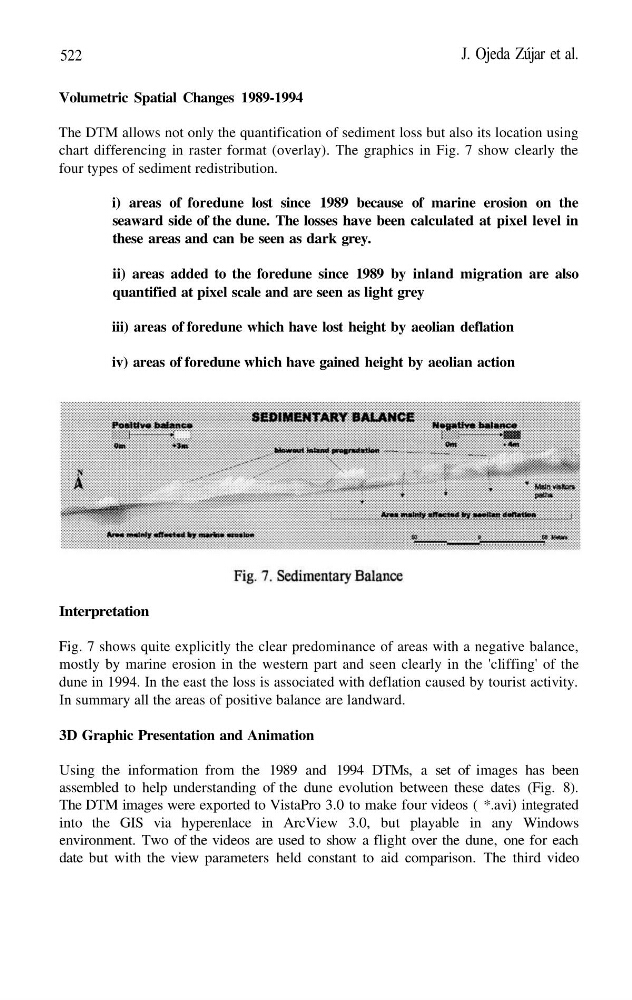
The DTM allows not only the quantification of sediment loss but also its location using
chart differencing in raster format (overlay). The graphics in Fig. 7 show clearly the
four types of sediment redistribution.
i) areas of foredune lost since 1989 because of marine erosion on the
seaward side of the dune. The losses have been calculated at pixel level in
these areas and can be seen as dark grey.
ii) areas added to the foredune since 1989 by inland migration are also
quantified at pixel scale and are seen as light grey
iii) areas of foredune which have lost height by aeolian deflation
iv) areas of foredune which have gained height by aeolian action
Interpretation
Fig. 7 shows quite explicitly the clear predominance of areas with a negative balance,
mostly by marine erosion in the western part and seen clearly in the 'cliffing' of the
dune in 1994. In the east the loss is associated with deflation caused by tourist activity.
In summary all the areas of positive balance are landward.
3D Graphic Presentation and Animation
Using the information from the 1989 and 1994 DTMs, a set of images has been
assembled to help understanding of the dune evolution between these dates (Fig. 8).
The DTM images were exported to VistaPro 3.0 to make four videos ( *.avi) integrated
into the GIS via hyperenlace in ArcView 3.0, but playable in any Windows
environment. Two of the videos are used to show a flight over the dune, one for each
date but with the view parameters held constant to aid comparison. The third video
J. Ojeda Zújar et al.
Volumetric Spatial Changes 1989-1994
The DTM allows not only the quantification of sediment loss but also its location using
chart differencing in raster format (overlay). The graphics in Fig. 7 show clearly the
four types of sediment redistribution.
i) areas of foredune lost since 1989 because of marine erosion on the
seaward side of the dune. The losses have been calculated at pixel level in
these areas and can be seen as dark grey.
ii) areas added to the foredune since 1989 by inland migration are also
quantified at pixel scale and are seen as light grey
iii) areas of foredune which have lost height by aeolian deflation
iv) areas of foredune which have gained height by aeolian action
Interpretation
Fig. 7 shows quite explicitly the clear predominance of areas with a negative balance,
mostly by marine erosion in the western part and seen clearly in the 'cliffing' of the
dune in 1994. In the east the loss is associated with deflation caused by tourist activity.
In summary all the areas of positive balance are landward.
3D Graphic Presentation and Animation
Using the information from the 1989 and 1994 DTMs, a set of images has been
assembled to help understanding of the dune evolution between these dates (Fig. 8).
The DTM images were exported to VistaPro 3.0 to make four videos ( *.avi) integrated
into the GIS via hyperenlace in ArcView 3.0, but playable in any Windows
environment. Two of the videos are used to show a flight over the dune, one for each
date but with the view parameters held constant to aid comparison. The third video