

Identifying Sites for Flood Protection
153
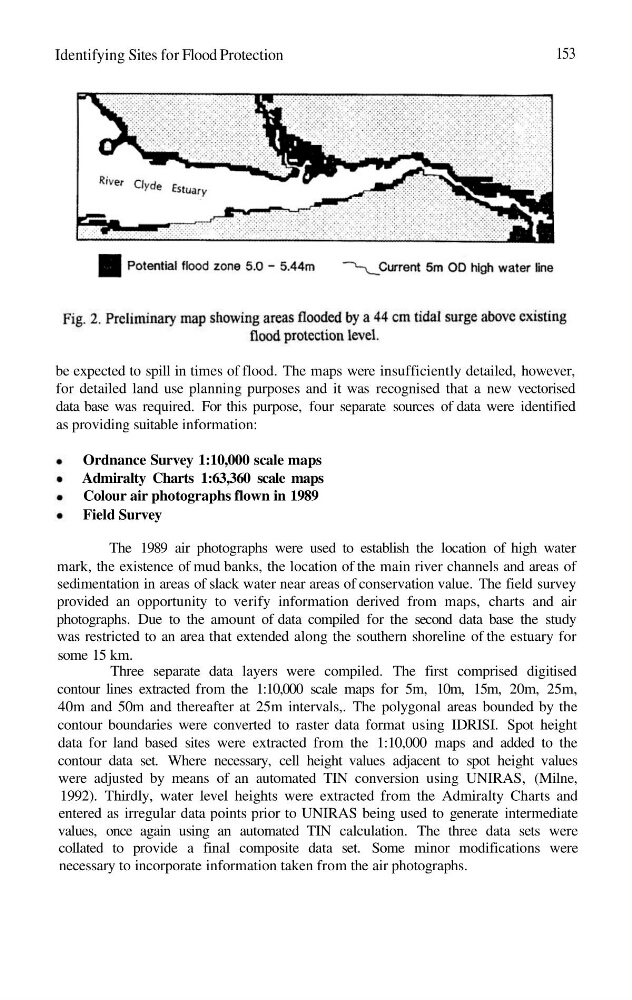
be expected to spill in times of flood. The maps were insufficiently detailed, however,
for detailed land use planning purposes and it was recognised that a new vectorised
data base was required. For this purpose, four separate sources of data were identified
as providing suitable information:
Ordnance Survey 1:10,000 scale maps
Admiralty Charts 1:63,360 scale maps
Colour air photographs flown in 1989
Field Survey
The 1989 air photographs were used to establish the location of high water
mark, the existence of mud banks, the location of the main river channels and areas of
sedimentation in areas of slack water near areas of conservation value. The field survey
provided an opportunity to verify information derived from maps, charts and air
photographs. Due to the amount of data compiled for the second data base the study
was restricted to an area that extended along the southern shoreline of the estuary for
some 15 km.
Three separate data layers were compiled. The first comprised digitised
contour lines extracted from the 1:10,000 scale maps for 5m, 10m, 15m, 20m, 25m,
40m and 50m and thereafter at 25m intervals,. The polygonal areas bounded by the
contour boundaries were converted to raster data format using IDRISI. Spot height
data for land based sites were extracted from the 1:10,000 maps and added to the
contour data set. Where necessary, cell height values adjacent to spot height values
were adjusted by means of an automated TIN conversion using UNIRAS, (Milne,
1992). Thirdly, water level heights were extracted from the Admiralty Charts and
entered as irregular data points prior to UNIRAS being used to generate intermediate
values, once again using an automated TIN calculation. The three data sets were
collated to provide a final composite data set. Some minor modifications were
necessary to incorporate information taken from the air photographs.
153
be expected to spill in times of flood. The maps were insufficiently detailed, however,
for detailed land use planning purposes and it was recognised that a new vectorised
data base was required. For this purpose, four separate sources of data were identified
as providing suitable information:
Ordnance Survey 1:10,000 scale maps
Admiralty Charts 1:63,360 scale maps
Colour air photographs flown in 1989
Field Survey
The 1989 air photographs were used to establish the location of high water
mark, the existence of mud banks, the location of the main river channels and areas of
sedimentation in areas of slack water near areas of conservation value. The field survey
provided an opportunity to verify information derived from maps, charts and air
photographs. Due to the amount of data compiled for the second data base the study
was restricted to an area that extended along the southern shoreline of the estuary for
some 15 km.
Three separate data layers were compiled. The first comprised digitised
contour lines extracted from the 1:10,000 scale maps for 5m, 10m, 15m, 20m, 25m,
40m and 50m and thereafter at 25m intervals,. The polygonal areas bounded by the
contour boundaries were converted to raster data format using IDRISI. Spot height
data for land based sites were extracted from the 1:10,000 maps and added to the
contour data set. Where necessary, cell height values adjacent to spot height values
were adjusted by means of an automated TIN conversion using UNIRAS, (Milne,
1992). Thirdly, water level heights were extracted from the Admiralty Charts and
entered as irregular data points prior to UNIRAS being used to generate intermediate
values, once again using an automated TIN calculation. The three data sets were
collated to provide a final composite data set. Some minor modifications were
necessary to incorporate information taken from the air photographs.