

154
G. Jones
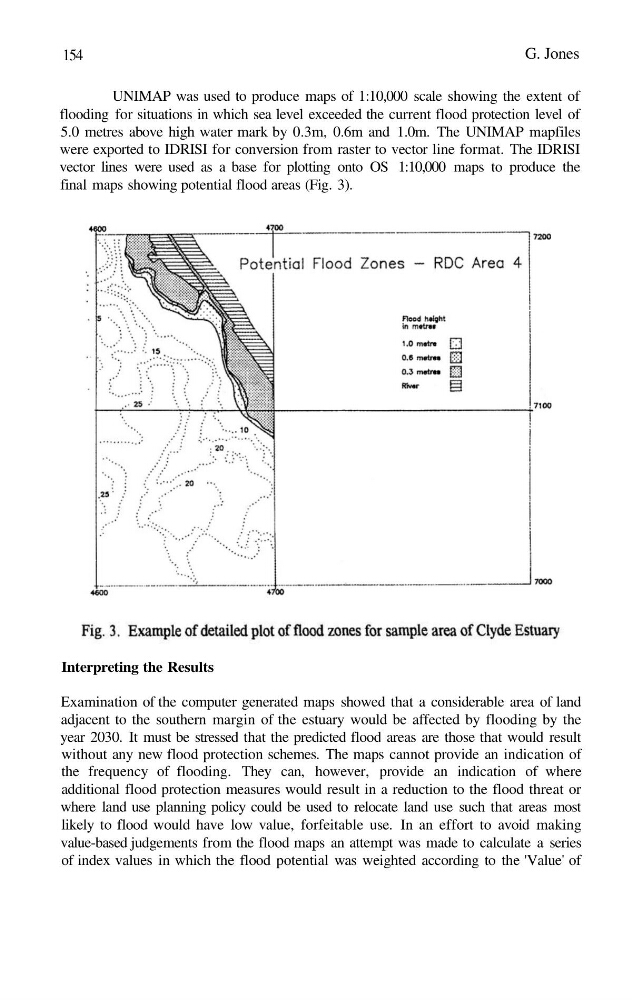
UNIMAP was used to produce maps of 1:10,000 scale showing the extent of
flooding for situations in which sea level exceeded the current flood protection level of
5.0 metres above high water mark by 0.3m, 0.6m and 1.0m. The UNIMAP mapfiles
were exported to IDRISI for conversion from raster to vector line format. The IDRISI
vector lines were used as a base for plotting onto OS 1:10,000 maps to produce the
final maps showing potential flood areas (Fig. 3).
Interpreting the Results
Examination of the computer generated maps showed that a considerable area of land
adjacent to the southern margin of the estuary would be affected by flooding by the
year 2030. It must be stressed that the predicted flood areas are those that would result
without any new flood protection schemes. The maps cannot provide an indication of
the frequency of flooding. They can, however, provide an indication of where
additional flood protection measures would result in a reduction to the flood threat or
where land use planning policy could be used to relocate land use such that areas most
likely to flood would have low value, forfeitable use. In an effort to avoid making
value-based judgements from the flood maps an attempt was made to calculate a series
of index values in which the flood potential was weighted according to the 'Value' of
G. Jones
UNIMAP was used to produce maps of 1:10,000 scale showing the extent of
flooding for situations in which sea level exceeded the current flood protection level of
5.0 metres above high water mark by 0.3m, 0.6m and 1.0m. The UNIMAP mapfiles
were exported to IDRISI for conversion from raster to vector line format. The IDRISI
vector lines were used as a base for plotting onto OS 1:10,000 maps to produce the
final maps showing potential flood areas (Fig. 3).
Interpreting the Results
Examination of the computer generated maps showed that a considerable area of land
adjacent to the southern margin of the estuary would be affected by flooding by the
year 2030. It must be stressed that the predicted flood areas are those that would result
without any new flood protection schemes. The maps cannot provide an indication of
the frequency of flooding. They can, however, provide an indication of where
additional flood protection measures would result in a reduction to the flood threat or
where land use planning policy could be used to relocate land use such that areas most
likely to flood would have low value, forfeitable use. In an effort to avoid making
value-based judgements from the flood maps an attempt was made to calculate a series
of index values in which the flood potential was weighted according to the 'Value' of