

Atmospheric Boundary Layer: Concepts and Measurements
29
season during the LBA/TRMM experiment (in 1999). Fisch et al. (2004) give more
details of the sites, instruments used, and the results obtained.
The CBL development shows different patterns for different surface soil moisture
conditions: for forests the CBL grows up to approximately 1000 m, independent of
the season (dry or wet). In contrast, the CBL at pasture shows strong seasonality
with a height of 1650 m during the dry season and around 1000 m in the wet season.
The soil moisture conditions determine the partition of surface energy and hence the
sensible heat fl uxes and consequently the height of CBL. For both sites, the highest
growth rates occur between 11:00 and 14:00 LT, when the atmosphere has strong
buoyancy and the sensible heat fl ux is very high. It should be noticed that the windspeed is reasonably low so the main force for convection is the buoyancy (this situation can be considered as a pure thermal convection). However, there is a signifi cant
change in the growth rate from the dry to the wet season, especially in the pasture:
during the dry season this rate is 320 m/h but diminishes to 100 m/h for the wet season (a factor of 3). For the other times of the day both sites present equivalent growth
rates (around 100 m/h in the early morning and about 60 m/h in the late afternoon).
Considering only the wet season, the results indicate that the CBL structure and
dynamics are triggered by the same mechanisms (e.g., large-scale circulations) at
both sites (tropical forest and pasture).
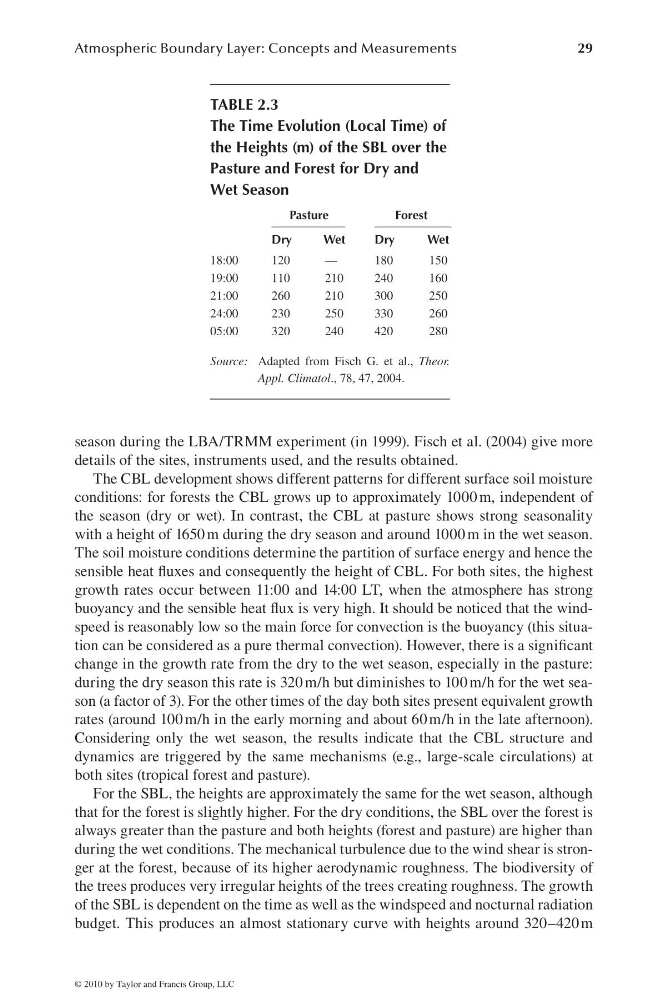
For the SBL, the heights are approximately the same for the wet season, although
that for the forest is slightly higher. For the dry conditions, the SBL over the forest is
always greater than the pasture and both heights (forest and pasture) are higher than
during the wet conditions. The mechanical turbulence due to the wind shear is stronger at the forest, because of its higher aerodynamic roughness. The biodiversity of
the trees produces very irregular heights of the trees creating roughness. The growth
of the SBL is dependent on the time as well as the windspeed and nocturnal radiation
budget. This produces an almost stationary curve with heights around 320–420 m
TABLE 2.3
The Time Evolution (Local Time) of
the Heights (m) of the SBL over the
Pasture and Forest for Dry and
Wet Season
Pasture
Forest
Dry
Wet
Dry
Wet
18:00
120
—
180
150
19:00
110
210
240
160
21:00
260
210
300
250
24:00
230
250
330
260
05:00
320
240
420
280
Source: Adapted from Fisch G. et al., Theor.
Appl. Climatol., 78, 47, 2004.
© 2010 by Taylor and Francis Group, LLC
29
season during the LBA/TRMM experiment (in 1999). Fisch et al. (2004) give more
details of the sites, instruments used, and the results obtained.
The CBL development shows different patterns for different surface soil moisture
conditions: for forests the CBL grows up to approximately 1000 m, independent of
the season (dry or wet). In contrast, the CBL at pasture shows strong seasonality
with a height of 1650 m during the dry season and around 1000 m in the wet season.
The soil moisture conditions determine the partition of surface energy and hence the
sensible heat fl uxes and consequently the height of CBL. For both sites, the highest
growth rates occur between 11:00 and 14:00 LT, when the atmosphere has strong
buoyancy and the sensible heat fl ux is very high. It should be noticed that the windspeed is reasonably low so the main force for convection is the buoyancy (this situation can be considered as a pure thermal convection). However, there is a signifi cant
change in the growth rate from the dry to the wet season, especially in the pasture:
during the dry season this rate is 320 m/h but diminishes to 100 m/h for the wet season (a factor of 3). For the other times of the day both sites present equivalent growth
rates (around 100 m/h in the early morning and about 60 m/h in the late afternoon).
Considering only the wet season, the results indicate that the CBL structure and
dynamics are triggered by the same mechanisms (e.g., large-scale circulations) at
both sites (tropical forest and pasture).
For the SBL, the heights are approximately the same for the wet season, although
that for the forest is slightly higher. For the dry conditions, the SBL over the forest is
always greater than the pasture and both heights (forest and pasture) are higher than
during the wet conditions. The mechanical turbulence due to the wind shear is stronger at the forest, because of its higher aerodynamic roughness. The biodiversity of
the trees produces very irregular heights of the trees creating roughness. The growth
of the SBL is dependent on the time as well as the windspeed and nocturnal radiation
budget. This produces an almost stationary curve with heights around 320–420 m
TABLE 2.3
The Time Evolution (Local Time) of
the Heights (m) of the SBL over the
Pasture and Forest for Dry and
Wet Season
Pasture
Forest
Dry
Wet
Dry
Wet
18:00
120
—
180
150
19:00
110
210
240
160
21:00
260
210
300
250
24:00
230
250
330
260
05:00
320
240
420
280
Source: Adapted from Fisch G. et al., Theor.
Appl. Climatol., 78, 47, 2004.
© 2010 by Taylor and Francis Group, LLC