

Atmospheric Boundary Layer: Concepts and Measurements
21
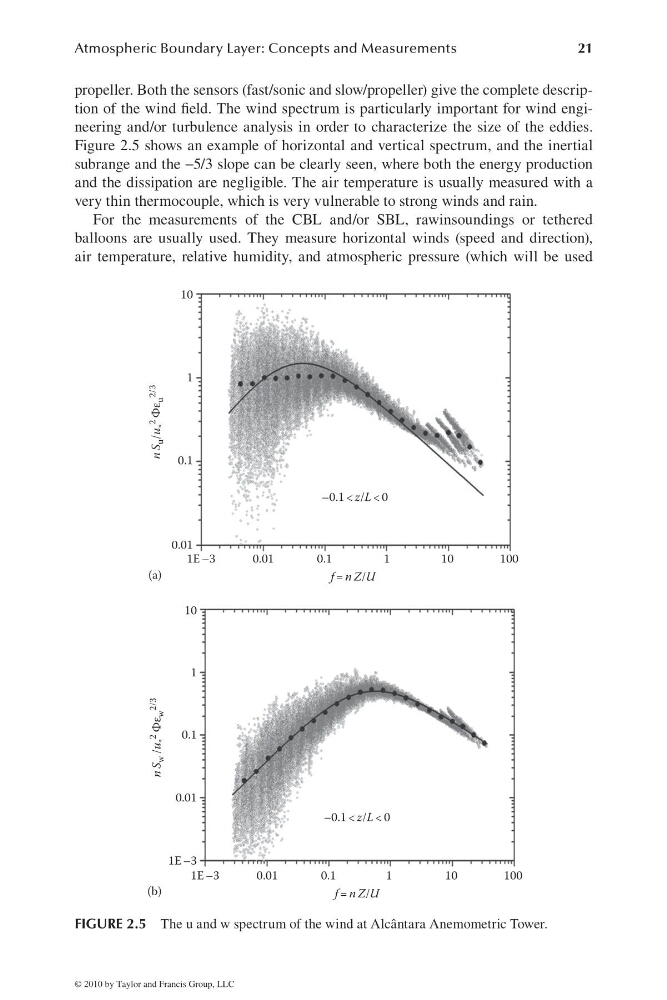
propeller. Both the sensors (fast/sonic and slow/propeller) give the complete description of the wind fi eld. The wind spectrum is particularly important for wind engineering and/or turbulence analysis in order to characterize the size of the eddies.
Figure 2.5 shows an example of horizontal and vertical spectrum, and the inertial
subrange and the −5/3 slope can be clearly seen, where both the energy production
and the dissipation are negligible. The air temperature is usually measured with a
very thin thermocouple, which is very vulnerable to strong winds and rain.
For the measurements of the CBL and/or SBL, rawinsoundings or tethered
balloons are usually used. They measure horizontal winds (speed and direction),
air temperature, relative humidity, and atmospheric pressure (which will be used
1E –3
0.01
0.01
0.1
1
10
(a)
(b)
0.1
f = n Z/U
n S
u /u
*
2
Φε
u
2/3
–0.1 < z/L < 0
1
10
100
1E –3
0.01
1E –3
0.01
1
0.1
10
0.1
f = n Z/U
n S
w /u
*
2
Φε
w
2/3
–0.1 < z/L < 0
1
10
100
FIGURE 2.5 The u and w spectrum of the wind at Alcântara Anemometric Tower.
© 2010 by Taylor and Francis Group, LLC
21
propeller. Both the sensors (fast/sonic and slow/propeller) give the complete description of the wind fi eld. The wind spectrum is particularly important for wind engineering and/or turbulence analysis in order to characterize the size of the eddies.
Figure 2.5 shows an example of horizontal and vertical spectrum, and the inertial
subrange and the −5/3 slope can be clearly seen, where both the energy production
and the dissipation are negligible. The air temperature is usually measured with a
very thin thermocouple, which is very vulnerable to strong winds and rain.
For the measurements of the CBL and/or SBL, rawinsoundings or tethered
balloons are usually used. They measure horizontal winds (speed and direction),
air temperature, relative humidity, and atmospheric pressure (which will be used
1E –3
0.01
0.01
0.1
1
10
(a)
(b)
0.1
f = n Z/U
n S
u /u
*
2
Φε
u
2/3
–0.1 < z/L < 0
1
10
100
1E –3
0.01
1E –3
0.01
1
0.1
10
0.1
f = n Z/U
n S
w /u
*
2
Φε
w
2/3
–0.1 < z/L < 0
1
10
100
FIGURE 2.5 The u and w spectrum of the wind at Alcântara Anemometric Tower.
© 2010 by Taylor and Francis Group, LLC