

18
Air Pollution and Turbulence: Modeling and Applications
2.3 MEASUREMENTS
The ABL can be studied by three different approaches: by measurements, by numerical
modeling, and by simulations using wind tunnel. However, only the direct measurements of the ABL will be discussed in detail. The others will be discussed only briefl y.
The direct measurements of the ABL can be classifi ed as surface in situ measurements made by masts or towers, balloon-borne measurements made by rawinsoundings, and/or tethered balloons. For the surface layer, usually masts/small towers
with several levels of temperature, air humidity, and winds (speed and direction)
are installed in order to characterize its structure. The required vertical spacing is
dependent on the height and the goals of the tower. Usually, at the surface layer,
the sensors should be installed in a logarithmic scale (to obey the Monin–Obhukov
Universal Theory) and linearly spaced above. They offer convenient platforms for
observing the mean and turbulent properties providing a useful dataset for characterization of the ABL. A detailed analysis can also be made and used for testing models/
parameterization used in numerical models. There are several tall towers in the world
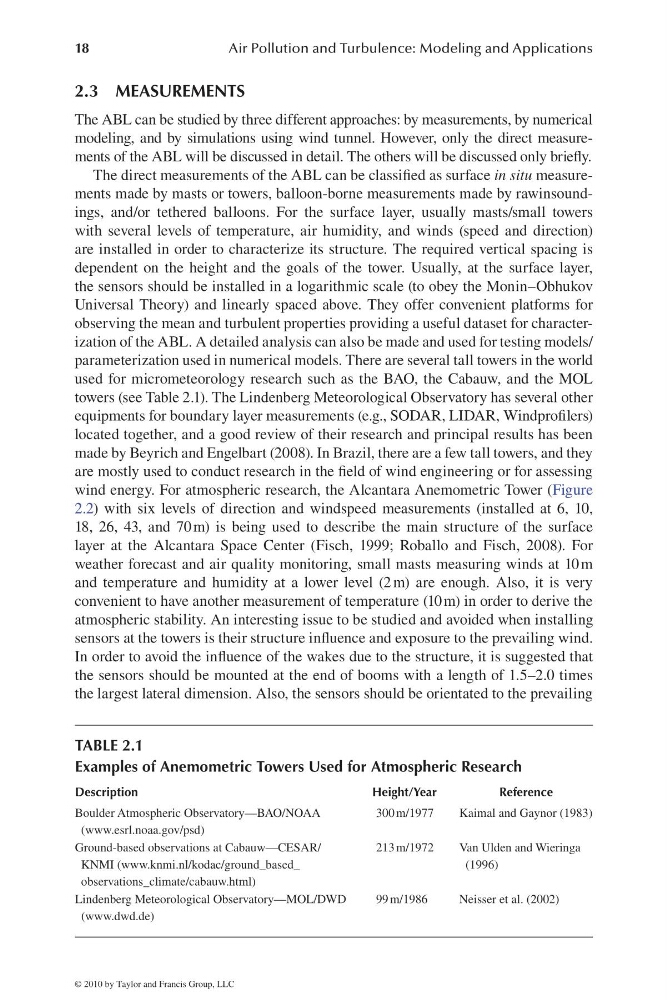
used for micrometeorology research such as the BAO, the Cabauw, and the MOL
towers (see Table 2.1). The Lindenberg Meteorological Observatory has several other
equipments for boundary layer measurements (e.g., SODAR, LIDAR, Windprofi lers)
located together, and a good review of their research and principal results has been
made by Beyrich and Engelbart (2008). In Brazil, there are a few tall towers, and they
are mostly used to conduct research in the fi eld of wind engineering or for assessing
wind energy. For atmospheric research, the Alcantara Anemometric Tower (Figure
2.2) with six levels of direction and windspeed measurements (installed at 6, 10,
18, 26, 43, and 70 m) is being used to describe the main structure of the surface
layer at the Alcantara Space Center (Fisch, 1999; Roballo and Fisch, 2008). For
weather forecast and air quality monitoring, small masts measuring winds at 10 m
and temperature and humidity at a lower level (2 m) are enough. Also, it is very
convenient to have another measurement of temperature (10 m) in order to derive the
atmospheric stability. An interesting issue to be studied and avoided when installing
sensors at the towers is their structure infl uence and exposure to the prevailing wind.
In order to avoid the infl uence of the wakes due to the structure, it is suggested that
the sensors should be mounted at the end of booms with a length of 1.5–2.0 times
the largest lateral dimension. Also, the sensors should be orientated to the prevailing
TABLE 2.1
Examples of Anemometric Towers Used for Atmospheric Research
Description
Height/Year
Reference
Boulder Atmospheric Observatory—BAO/NOAA
(www.esrl.noaa.gov/psd)
300 m/1977
Kaimal and Gaynor (1983)
Ground-based observations at Cabauw—CESAR/
KNMI (www.knmi.nl/kodac/ground_based_
observations_climate/cabauw.html)
213 m/1972
Van Ulden and Wieringa
(1996)
Lindenberg Meteorological Observatory—MOL/DWD
(www.dwd.de)
99 m/1986
Neisser et al. (2002)
© 2010 by Taylor and Francis Group, LLC
Air Pollution and Turbulence: Modeling and Applications
2.3 MEASUREMENTS
The ABL can be studied by three different approaches: by measurements, by numerical
modeling, and by simulations using wind tunnel. However, only the direct measurements of the ABL will be discussed in detail. The others will be discussed only briefl y.
The direct measurements of the ABL can be classifi ed as surface in situ measurements made by masts or towers, balloon-borne measurements made by rawinsoundings, and/or tethered balloons. For the surface layer, usually masts/small towers
with several levels of temperature, air humidity, and winds (speed and direction)
are installed in order to characterize its structure. The required vertical spacing is
dependent on the height and the goals of the tower. Usually, at the surface layer,
the sensors should be installed in a logarithmic scale (to obey the Monin–Obhukov
Universal Theory) and linearly spaced above. They offer convenient platforms for
observing the mean and turbulent properties providing a useful dataset for characterization of the ABL. A detailed analysis can also be made and used for testing models/
parameterization used in numerical models. There are several tall towers in the world
used for micrometeorology research such as the BAO, the Cabauw, and the MOL
towers (see Table 2.1). The Lindenberg Meteorological Observatory has several other
equipments for boundary layer measurements (e.g., SODAR, LIDAR, Windprofi lers)
located together, and a good review of their research and principal results has been
made by Beyrich and Engelbart (2008). In Brazil, there are a few tall towers, and they
are mostly used to conduct research in the fi eld of wind engineering or for assessing
wind energy. For atmospheric research, the Alcantara Anemometric Tower (Figure
2.2) with six levels of direction and windspeed measurements (installed at 6, 10,
18, 26, 43, and 70 m) is being used to describe the main structure of the surface
layer at the Alcantara Space Center (Fisch, 1999; Roballo and Fisch, 2008). For
weather forecast and air quality monitoring, small masts measuring winds at 10 m
and temperature and humidity at a lower level (2 m) are enough. Also, it is very
convenient to have another measurement of temperature (10 m) in order to derive the
atmospheric stability. An interesting issue to be studied and avoided when installing
sensors at the towers is their structure infl uence and exposure to the prevailing wind.
In order to avoid the infl uence of the wakes due to the structure, it is suggested that
the sensors should be mounted at the end of booms with a length of 1.5–2.0 times
the largest lateral dimension. Also, the sensors should be orientated to the prevailing
TABLE 2.1
Examples of Anemometric Towers Used for Atmospheric Research
Description
Height/Year
Reference
Boulder Atmospheric Observatory—BAO/NOAA
(www.esrl.noaa.gov/psd)
300 m/1977
Kaimal and Gaynor (1983)
Ground-based observations at Cabauw—CESAR/
KNMI (www.knmi.nl/kodac/ground_based_
observations_climate/cabauw.html)
213 m/1972
Van Ulden and Wieringa
(1996)
Lindenberg Meteorological Observatory—MOL/DWD
(www.dwd.de)
99 m/1986
Neisser et al. (2002)
© 2010 by Taylor and Francis Group, LLC