

280
Air Pollution and Turbulence: Modeling and Applications
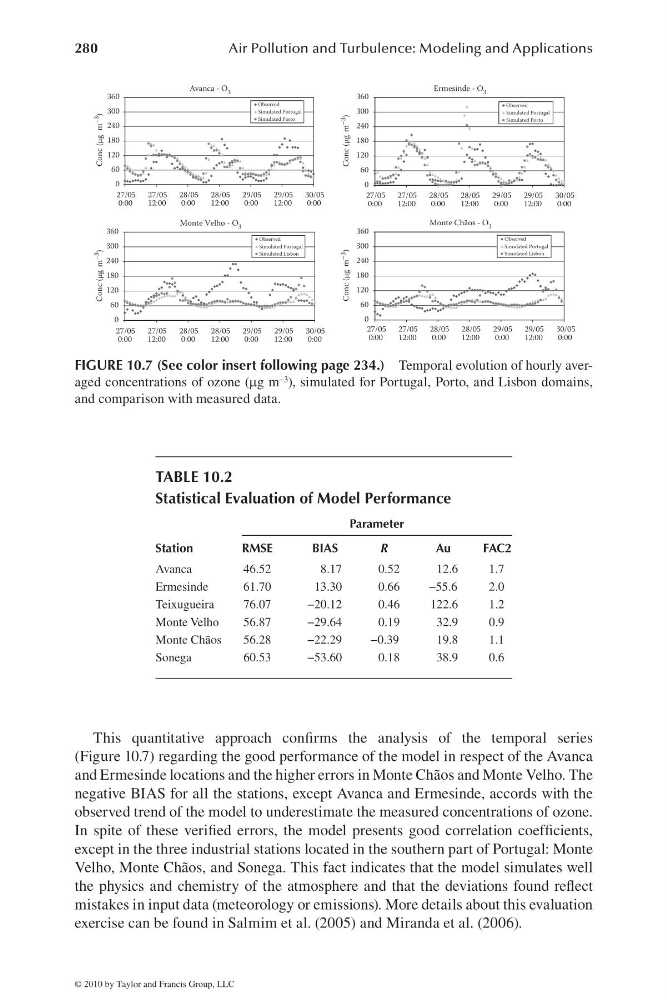
This quantitative approach confi rms the analysis of the temporal series
(Figure 10.7) regarding the good performance of the model in respect of the Avanca
and Ermesinde locations and the higher errors in Monte Chãos and Monte Velho. The
negative BIAS for all the stations, except Avanca and Ermesinde, accords with the
observed trend of the model to underestimate the measured concentrations of ozone.
In spite of these verifi ed errors, the model presents good correlation coeffi cients,
except in the three industrial stations located in the southern part of Portugal: Monte
Velho, Monte Chãos, and Sonega. This fact indicates that the model simulates well
the physics and chemistry of the atmosphere and that the deviations found refl ect
mistakes in input data (meteorology or emissions). More details about this evaluation
exercise can be found in Salmim et al. (2005) and Miranda et al. (2006).
Avanca - O 3
0
60
120
180
240
300
360
27/05
0:00
27/05
12:00
28/05
0:00
28/05
12:00
29/05
0:00
29/05
12:00
30/05
0:00
Conc (μg m –3
)
Observed
Simulated Portugal
Simulated Porto
Ermesinde - O 3
0
60
120
180
240
300
360
27/05
0:00
27/05
12:00
28/05
0:00
28/05
12:00
29/05
0:00
29/05
12:00
30/05
0:00
Conc (μg m –3
)
Observed
Simulated Portugal
Simulated Porto
Monte Velho - O 3
0
60
120
180
240
300
360
27/05
0:00
27/05
12:00
28/05
0:00
28/05
12:00
29/05
0:00
29/05
12:00
30/05
0:00
Conc (μg m –3
)
Observed
Simulated Portugal
Simulated Lisbon
Monte Chãos - O 3
0
60
120
180
240
300
360
27/05
0:00
27/05
12:00
28/05
0:00
28/05
12:00
29/05
0:00
29/05
12:00
30/05
0:00
Conc (μg m –3
)
Observed
Simulated Portugal
Simulated Lisbon
FIGURE 10.7 (See color insert following page 234.) Temporal evolution of hourly averaged concentrations of ozone (mg m −3 ), simulated for Portugal, Porto, and Lisbon domains,
and comparison with measured data.
TABLE 10.2
Statistical Evaluation of Model Performance
Station
Parameter
RMSE
BIAS
R
Au
FAC2
Avanca
46.52
8.17
0.52
12.6
1.7
Ermesinde
61.70
13.30
0.66
−55.6
2.0
Teixugueira
76.07
−20.12
0.46
122.6
1.2
Monte Velho
56.87
−29.64
0.19
32.9
0.9
Monte Chãos
56.28
−22.29
−0.39
19.8
1.1
Sonega
60.53
−53.60
0.18
38.9
0.6
© 2010 by Taylor and Francis Group, LLC
Air Pollution and Turbulence: Modeling and Applications
This quantitative approach confi rms the analysis of the temporal series
(Figure 10.7) regarding the good performance of the model in respect of the Avanca
and Ermesinde locations and the higher errors in Monte Chãos and Monte Velho. The
negative BIAS for all the stations, except Avanca and Ermesinde, accords with the
observed trend of the model to underestimate the measured concentrations of ozone.
In spite of these verifi ed errors, the model presents good correlation coeffi cients,
except in the three industrial stations located in the southern part of Portugal: Monte
Velho, Monte Chãos, and Sonega. This fact indicates that the model simulates well
the physics and chemistry of the atmosphere and that the deviations found refl ect
mistakes in input data (meteorology or emissions). More details about this evaluation
exercise can be found in Salmim et al. (2005) and Miranda et al. (2006).
Avanca - O 3
0
60
120
180
240
300
360
27/05
0:00
27/05
12:00
28/05
0:00
28/05
12:00
29/05
0:00
29/05
12:00
30/05
0:00
Conc (μg m –3
)
Observed
Simulated Portugal
Simulated Porto
Ermesinde - O 3
0
60
120
180
240
300
360
27/05
0:00
27/05
12:00
28/05
0:00
28/05
12:00
29/05
0:00
29/05
12:00
30/05
0:00
Conc (μg m –3
)
Observed
Simulated Portugal
Simulated Porto
Monte Velho - O 3
0
60
120
180
240
300
360
27/05
0:00
27/05
12:00
28/05
0:00
28/05
12:00
29/05
0:00
29/05
12:00
30/05
0:00
Conc (μg m –3
)
Observed
Simulated Portugal
Simulated Lisbon
Monte Chãos - O 3
0
60
120
180
240
300
360
27/05
0:00
27/05
12:00
28/05
0:00
28/05
12:00
29/05
0:00
29/05
12:00
30/05
0:00
Conc (μg m –3
)
Observed
Simulated Portugal
Simulated Lisbon
FIGURE 10.7 (See color insert following page 234.) Temporal evolution of hourly averaged concentrations of ozone (mg m −3 ), simulated for Portugal, Porto, and Lisbon domains,
and comparison with measured data.
TABLE 10.2
Statistical Evaluation of Model Performance
Station
Parameter
RMSE
BIAS
R
Au
FAC2
Avanca
46.52
8.17
0.52
12.6
1.7
Ermesinde
61.70
13.30
0.66
−55.6
2.0
Teixugueira
76.07
−20.12
0.46
122.6
1.2
Monte Velho
56.87
−29.64
0.19
32.9
0.9
Monte Chãos
56.28
−22.29
−0.39
19.8
1.1
Sonega
60.53
−53.60
0.18
38.9
0.6
© 2010 by Taylor and Francis Group, LLC