

Photochemical Air Pollution Modeling
279
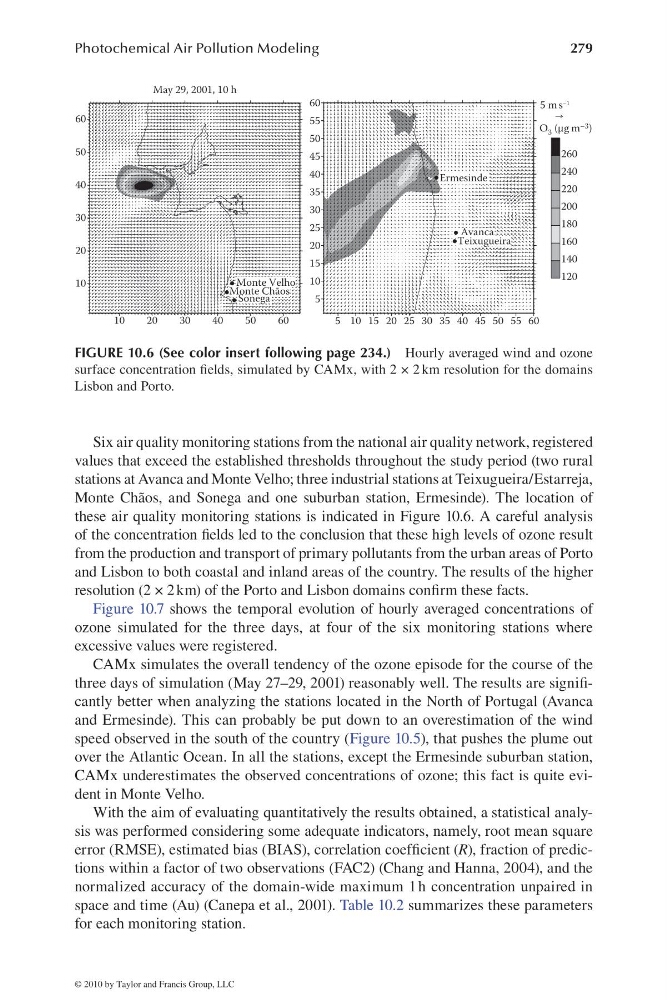
Six air quality monitoring stations from the national air quality network, registered
values that exceed the established thresholds throughout the study period (two rural
stations at Avanca and Monte Velho; three industrial stations at Teixugueira/Estarreja,
Monte Chãos, and Sonega and one suburban station, Ermesinde). The location of
these air quality monitoring stations is indicated in Figure 10.6. A careful analysis
of the concentration fi elds led to the conclusion that these high levels of ozone result
from the production and transport of primary pollutants from the urban areas of Porto
and Lisbon to both coastal and inland areas of the country. The results of the higher
resolution (2 × 2 km) of the Porto and Lisbon domains confi rm these facts.
Figure 10.7 shows the temporal evolution of hourly averaged concentrations of
ozone simulated for the three days, at four of the six monitoring stations where
excessive values were registered.
CAMx simulates the overall tendency of the ozone episode for the course of the
three days of simulation (May 27–29, 2001) reasonably well. The results are signifi -
cantly better when analyzing the stations located in the North of Portugal (Avanca
and Ermesinde). This can probably be put down to an overestimation of the wind
speed observed in the south of the country (Figure 10.5), that pushes the plume out
over the Atlantic Ocean. In all the stations, except the Ermesinde suburban station,
CAMx underestimates the observed concentrations of ozone; this fact is quite evident in Monte Velho.
With the aim of evaluating quantitatively the results obtained, a statistical analysis was performed considering some adequate indicators, namely, root mean square
error (RMSE), estimated bias (BIAS), correlation coeffi cient (R), fraction of predictions within a factor of two observations (FAC2) (Chang and Hanna, 2004), and the
normalized accuracy of the domain-wide maximum 1 h concentration unpaired in
space and time (Au) (Canepa et al., 2001). Table 10.2 summarizes these parameters
for each monitoring station.
10
20
30
40
50
60
May 29, 2001, 10 h
5
5 10
10
20
30
40
50
60
15 20 25 30 35 40 45 50 55 60
10
15
20
25
30
35
40
45
50
55
120
140
160
180
200
220
240
260
O 3 (μg m –3 )
60
5 m s –1
Ermesinde
Avanca
Teixugueira
Sonega
Monte Velho
Monte Chãos
FIGURE 10.6 (See color insert following page 234.) Hourly averaged wind and ozone
surface concentration fi elds, simulated by CAMx, with 2 × 2 km resolution for the domains
Lisbon and Porto.
© 2010 by Taylor and Francis Group, LLC
279
Six air quality monitoring stations from the national air quality network, registered
values that exceed the established thresholds throughout the study period (two rural
stations at Avanca and Monte Velho; three industrial stations at Teixugueira/Estarreja,
Monte Chãos, and Sonega and one suburban station, Ermesinde). The location of
these air quality monitoring stations is indicated in Figure 10.6. A careful analysis
of the concentration fi elds led to the conclusion that these high levels of ozone result
from the production and transport of primary pollutants from the urban areas of Porto
and Lisbon to both coastal and inland areas of the country. The results of the higher
resolution (2 × 2 km) of the Porto and Lisbon domains confi rm these facts.
Figure 10.7 shows the temporal evolution of hourly averaged concentrations of
ozone simulated for the three days, at four of the six monitoring stations where
excessive values were registered.
CAMx simulates the overall tendency of the ozone episode for the course of the
three days of simulation (May 27–29, 2001) reasonably well. The results are signifi -
cantly better when analyzing the stations located in the North of Portugal (Avanca
and Ermesinde). This can probably be put down to an overestimation of the wind
speed observed in the south of the country (Figure 10.5), that pushes the plume out
over the Atlantic Ocean. In all the stations, except the Ermesinde suburban station,
CAMx underestimates the observed concentrations of ozone; this fact is quite evident in Monte Velho.
With the aim of evaluating quantitatively the results obtained, a statistical analysis was performed considering some adequate indicators, namely, root mean square
error (RMSE), estimated bias (BIAS), correlation coeffi cient (R), fraction of predictions within a factor of two observations (FAC2) (Chang and Hanna, 2004), and the
normalized accuracy of the domain-wide maximum 1 h concentration unpaired in
space and time (Au) (Canepa et al., 2001). Table 10.2 summarizes these parameters
for each monitoring station.
10
20
30
40
50
60
May 29, 2001, 10 h
5
5 10
10
20
30
40
50
60
15 20 25 30 35 40 45 50 55 60
10
15
20
25
30
35
40
45
50
55
120
140
160
180
200
220
240
260
O 3 (μg m –3 )
60
5 m s –1
Ermesinde
Avanca
Teixugueira
Sonega
Monte Velho
Monte Chãos
FIGURE 10.6 (See color insert following page 234.) Hourly averaged wind and ozone
surface concentration fi elds, simulated by CAMx, with 2 × 2 km resolution for the domains
Lisbon and Porto.
© 2010 by Taylor and Francis Group, LLC