

Photochemical Air Pollution Modeling
281
10.3.4 PTEN SCENARIO RESULTS
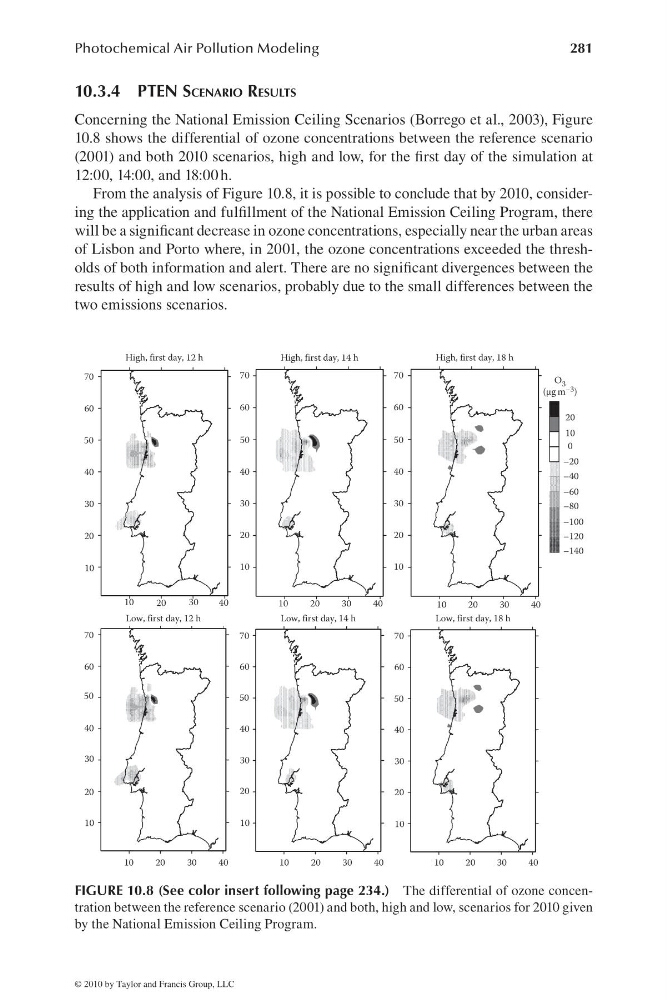
Concerning the National Emission Ceiling Scenarios (Borrego et al., 2003), Figure
10.8 shows the differential of ozone concentrations between the reference scenario
(2001) and both 2010 scenarios, high and low, for the fi rst day of the simulation at
12:00, 14:00, and 18:00 h.
From the analysis of Figure 10.8, it is possible to conclude that by 2010, considering the application and fulfi llment of the National Emission Ceiling Program, there
will be a signifi cant decrease in ozone concentrations, especially near the urban areas
of Lisbon and Porto where, in 2001, the ozone concentrations exceeded the thresholds of both information and alert. There are no signifi cant divergences between the
results of high and low scenarios, probably due to the small differences between the
two emissions scenarios.
High, first day, 12 h
10
20
30
40
50
60
70
10
20
30
40
50
60
70
10
20
30
40
50
60
70
10
20
30
40
50
60
70
High, first day, 14 h
10
20
30
40
50
60
70
10
20
30
40
50
60
70
High, first day, 18 h
–140
–120
–100
–80
–60
–40
–20
0
10
20
O 3
(μg m –3 )
Low, first day, 12 h
Low, first day, 14 h
Low, first day, 18 h
10
20
30
40
20
30
10
40
10
20
30
40
10
20
30
40
10
20
30
40
10
20
30
40
FIGURE 10.8 (See color insert following page 234.) The differential of ozone concentration between the reference scenario (2001) and both, high and low, scenarios for 2010 given
by the National Emission Ceiling Program.
© 2010 by Taylor and Francis Group, LLC
281
10.3.4 PTEN SCENARIO RESULTS
Concerning the National Emission Ceiling Scenarios (Borrego et al., 2003), Figure
10.8 shows the differential of ozone concentrations between the reference scenario
(2001) and both 2010 scenarios, high and low, for the fi rst day of the simulation at
12:00, 14:00, and 18:00 h.
From the analysis of Figure 10.8, it is possible to conclude that by 2010, considering the application and fulfi llment of the National Emission Ceiling Program, there
will be a signifi cant decrease in ozone concentrations, especially near the urban areas
of Lisbon and Porto where, in 2001, the ozone concentrations exceeded the thresholds of both information and alert. There are no signifi cant divergences between the
results of high and low scenarios, probably due to the small differences between the
two emissions scenarios.
High, first day, 12 h
10
20
30
40
50
60
70
10
20
30
40
50
60
70
10
20
30
40
50
60
70
10
20
30
40
50
60
70
High, first day, 14 h
10
20
30
40
50
60
70
10
20
30
40
50
60
70
High, first day, 18 h
–140
–120
–100
–80
–60
–40
–20
0
10
20
O 3
(μg m –3 )
Low, first day, 12 h
Low, first day, 14 h
Low, first day, 18 h
10
20
30
40
20
30
10
40
10
20
30
40
10
20
30
40
10
20
30
40
10
20
30
40
FIGURE 10.8 (See color insert following page 234.) The differential of ozone concentration between the reference scenario (2001) and both, high and low, scenarios for 2010 given
by the National Emission Ceiling Program.
© 2010 by Taylor and Francis Group, LLC