

Deposition, Transformation, and Remobilization of Soot and Diesel
9
would be needed to assess whether a value of 2–3 μg m −3 would be appropriate as
an air pollution standard (Brimblecombe and Grossi, 2005). In the near future we
expect lower concentrations of EC in many European cities where regulatory controls are increasingly in place. This means that it should be possible to meet the
2–3 μg m −3 level except for historic buildings close to very busy roads.
1.8 BLACKENING PATTERNS
The analysis above treats buildings as though they take on a homogeneous dark color
over time. This is not true and despite the fact that respondents to our questionnaires
found little diffi culty in assessing the tone of a building by comparison with a grey
scale, the black discoloration takes distinct forms and patterns. One respondent to
our survey thought the building might be darker or lighter, but should not appear as
it does, with long black streaks washed by rainwater (see Figure 1.1).
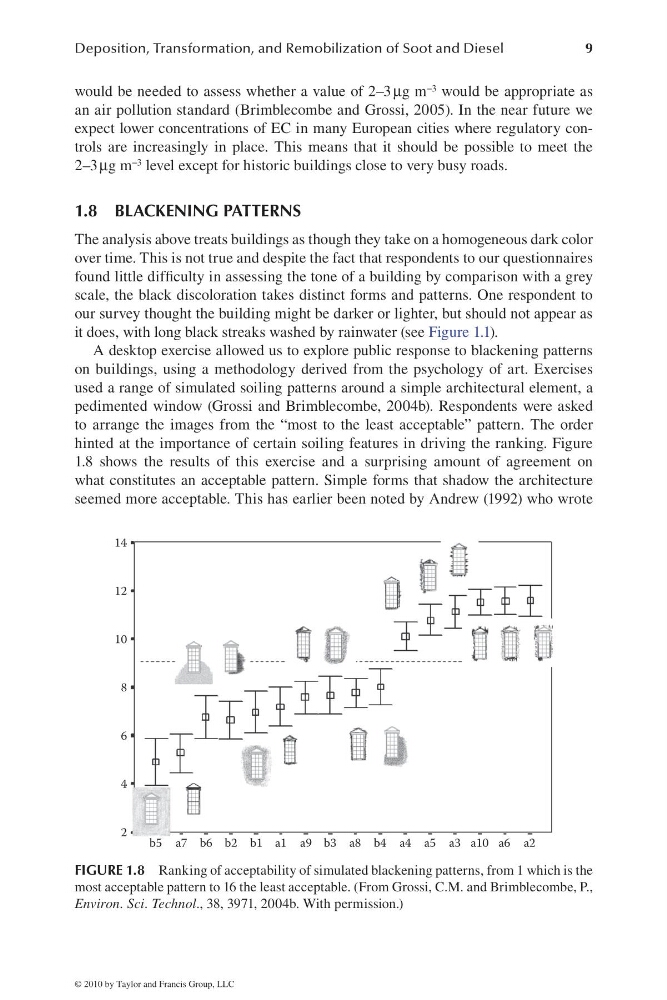
A desktop exercise allowed us to explore public response to blackening patterns
on buildings, using a methodology derived from the psychology of art. Exercises
used a range of simulated soiling patterns around a simple architectural element, a
pedimented window (Grossi and Brimblecombe, 2004b). Respondents were asked
to arrange the images from the “most to the least acceptable” pattern. The order
hinted at the importance of certain soiling features in driving the ranking. Figure
1.8 shows the results of this exercise and a surprising amount of agreement on
what constitutes an acceptable pattern. Simple forms that shadow the architecture
seemed more acceptable. This has earlier been noted by Andrew (1992) who wrote
2
b5
b6 b2 b1 a1 a9
a8
a4
a3
a6 a2
a10
a5
b3
b4
a7
4
6
8
10
12
14
FIGURE 1.8 Ranking of acceptability of simulated blackening patterns, from 1 which is the
most acceptable pattern to 16 the least acceptable. (From Grossi, C.M. and Brimblecombe, P.,
Environ. Sci. Technol., 38, 3971, 2004b. With permission.)
© 2010 by Taylor and Francis Group, LLC
9
would be needed to assess whether a value of 2–3 μg m −3 would be appropriate as
an air pollution standard (Brimblecombe and Grossi, 2005). In the near future we
expect lower concentrations of EC in many European cities where regulatory controls are increasingly in place. This means that it should be possible to meet the
2–3 μg m −3 level except for historic buildings close to very busy roads.
1.8 BLACKENING PATTERNS
The analysis above treats buildings as though they take on a homogeneous dark color
over time. This is not true and despite the fact that respondents to our questionnaires
found little diffi culty in assessing the tone of a building by comparison with a grey
scale, the black discoloration takes distinct forms and patterns. One respondent to
our survey thought the building might be darker or lighter, but should not appear as
it does, with long black streaks washed by rainwater (see Figure 1.1).
A desktop exercise allowed us to explore public response to blackening patterns
on buildings, using a methodology derived from the psychology of art. Exercises
used a range of simulated soiling patterns around a simple architectural element, a
pedimented window (Grossi and Brimblecombe, 2004b). Respondents were asked
to arrange the images from the “most to the least acceptable” pattern. The order
hinted at the importance of certain soiling features in driving the ranking. Figure
1.8 shows the results of this exercise and a surprising amount of agreement on
what constitutes an acceptable pattern. Simple forms that shadow the architecture
seemed more acceptable. This has earlier been noted by Andrew (1992) who wrote
2
b5
b6 b2 b1 a1 a9
a8
a4
a3
a6 a2
a10
a5
b3
b4
a7
4
6
8
10
12
14
FIGURE 1.8 Ranking of acceptability of simulated blackening patterns, from 1 which is the
most acceptable pattern to 16 the least acceptable. (From Grossi, C.M. and Brimblecombe, P.,
Environ. Sci. Technol., 38, 3971, 2004b. With permission.)
© 2010 by Taylor and Francis Group, LLC