

8
Air Pollution and Turbulence: Modeling and Applications
0
50
100
(a)
0
0
50
100
50
100
150
% answering “it’s dirty”
% answering
“it’s dark”
(b)
% answering
“it needs cleaning”
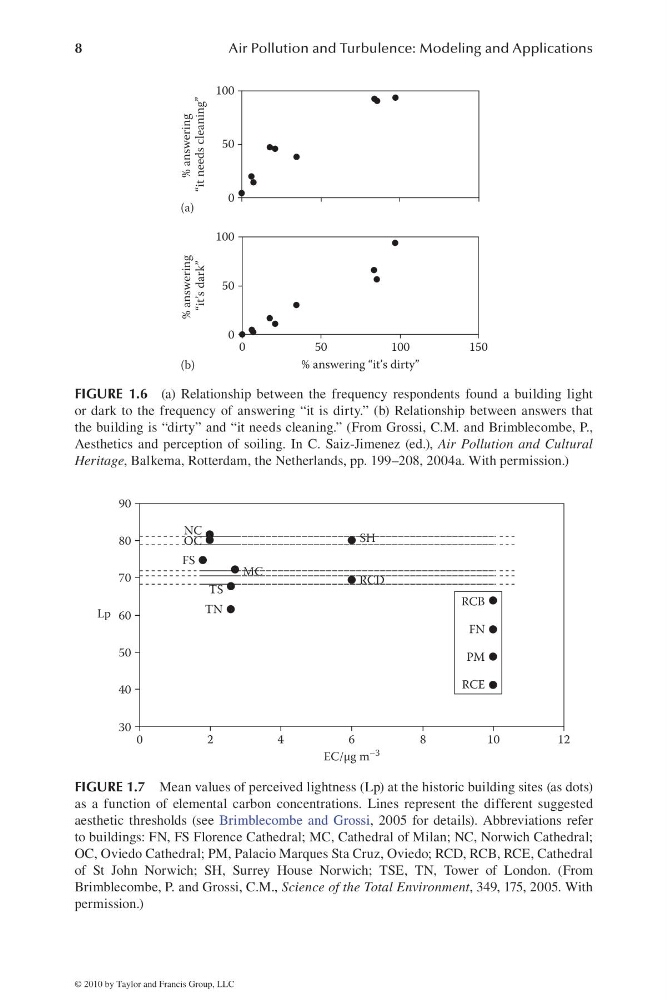
FIGURE 1.6 (a) Relationship between the frequency respondents found a building light
or dark to the frequency of answering “it is dirty.” (b) Relationship between answers that
the building is “dirty” and “it needs cleaning.” (From Grossi, C.M. and Brimblecombe, P.,
Aesthetics and perception of soiling. In C. Saiz-Jimenez (ed.), Air Pollution and Cultural
Heritage, Balkema, Rotterdam, the Netherlands, pp. 199–208, 2004a. With permission.)
0
30
40
50
60
70
80
90
2
Lp
4
6
8
1 0
1 2
EC/μg m –3
RCB
RCE
FN
PM
NC
OC
FS
TS
TN
MC
SH
RCD
FIGURE 1.7 Mean values of perceived lightness (Lp) at the historic building sites (as dots)
as a function of elemental carbon concentrations. Lines represent the different suggested
aesthetic thresholds (see Brimblecombe and Grossi, 2005 for details). Abbreviations refer
to buildings: FN, FS Florence Cathedral; MC, Cathedral of Milan; NC, Norwich Cathedral;
OC, Oviedo Cathedral; PM, Palacio Marques Sta Cruz, Oviedo; RCD, RCB, RCE, Cathedral
of St John Norwich; SH, Surrey House Norwich; TSE, TN, Tower of London. (From
Brimblecombe, P. and Grossi, C.M., Science of the Total Environment, 349, 175, 2005. With
permission.)
© 2010 by Taylor and Francis Group, LLC
Air Pollution and Turbulence: Modeling and Applications
0
50
100
(a)
0
0
50
100
50
100
150
% answering “it’s dirty”
% answering
“it’s dark”
(b)
% answering
“it needs cleaning”
FIGURE 1.6 (a) Relationship between the frequency respondents found a building light
or dark to the frequency of answering “it is dirty.” (b) Relationship between answers that
the building is “dirty” and “it needs cleaning.” (From Grossi, C.M. and Brimblecombe, P.,
Aesthetics and perception of soiling. In C. Saiz-Jimenez (ed.), Air Pollution and Cultural
Heritage, Balkema, Rotterdam, the Netherlands, pp. 199–208, 2004a. With permission.)
0
30
40
50
60
70
80
90
2
Lp
4
6
8
1 0
1 2
EC/μg m –3
RCB
RCE
FN
PM
NC
OC
FS
TS
TN
MC
SH
RCD
FIGURE 1.7 Mean values of perceived lightness (Lp) at the historic building sites (as dots)
as a function of elemental carbon concentrations. Lines represent the different suggested
aesthetic thresholds (see Brimblecombe and Grossi, 2005 for details). Abbreviations refer
to buildings: FN, FS Florence Cathedral; MC, Cathedral of Milan; NC, Norwich Cathedral;
OC, Oviedo Cathedral; PM, Palacio Marques Sta Cruz, Oviedo; RCD, RCB, RCE, Cathedral
of St John Norwich; SH, Surrey House Norwich; TSE, TN, Tower of London. (From
Brimblecombe, P. and Grossi, C.M., Science of the Total Environment, 349, 175, 2005. With
permission.)
© 2010 by Taylor and Francis Group, LLC