

192
Air Pollution and Turbulence: Modeling and Applications
ground-level positions at the maximum of three crosswind arcs. The sampling units
were positioned at 2–6 km from the point of release. The site was mainly residential
with a roughness length of 0.6 m.
In the Prairie–Grass experiment, according to Barad (1958), the tracer SO 2 was
released without buoyancy at a height of 0.46 m, and collected at a height of 1.5 m
at fi ve downwind distances (50, 100, 200, 400, and 800 m) at O’Neill, Nebraska in
1956. The Prairie-Grass site was quite fl at and much smooth with a roughness length
of 0.6 cm. In this chapter, we consider the experimental data appearing in the paper
of Nieuwstadt (1980).
Experiments of pollutant dispersion under low wind conditions were done at
Indian Institute of Technology and described by Sharan et al. (1996a,b; 2002). The
contaminant was released without buoyancy at a height of 1 m and the concentration
measured near the ground (0.5 m). The emission rate of the SF 6 tracer ranged from
30 to 50 mL/min. The sample period for each experiment was 30 min. The wind and
temperature were measured at four heights (2, 4, 15, and 30 m) from a meteorological
tower of 30 m. The samplers were positioned in arcs with radius of 50 and 100 m with
a source distance of 100 m.
7.5 APPLICATIONS
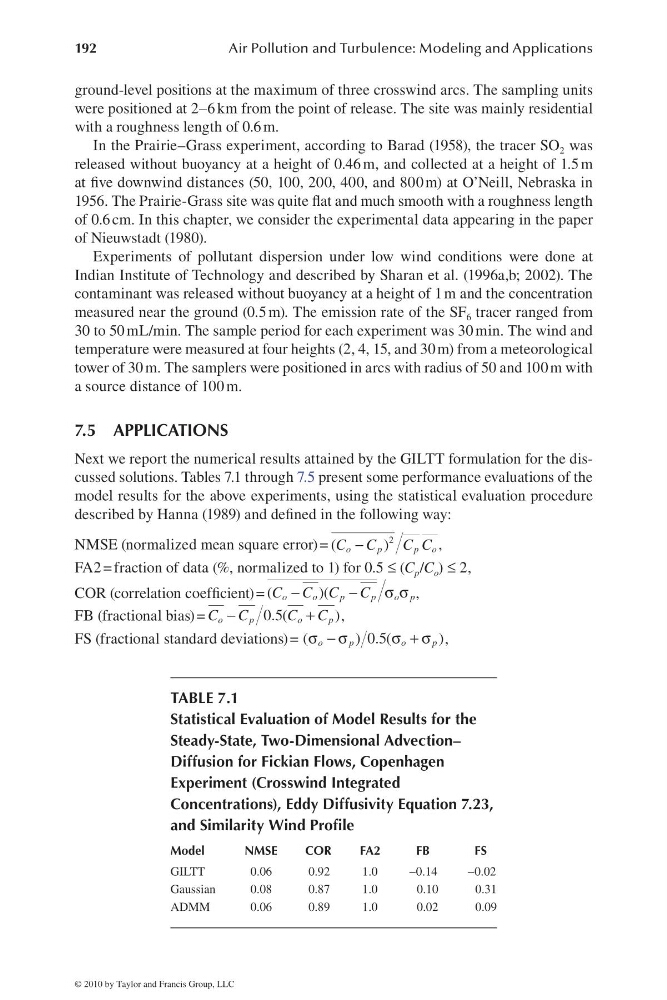
Next we report the numerical results attained by the GILTT formulation for the discussed solutions. Tables 7.1 through 7.5 present some performance evaluations of the
model results for the above experiments, using the statistical evaluation procedure
described by Hanna (1989) and defi ned in the following way:
NMSE (normalized mean square error) =
2
(
)
o
p
p o
C C
C C
−
,
FA2 = fraction of data (%, normalized to 1) for 0.5 ≤ (C p /C o ) ≤ 2,
COR (correlation coeffi cient) = (
) (
o
o
p
p
o p
C C C C
−
−
σσ ,
FB (fractional bias) =
0.5(
)
o
p
o
p
C C
C C
−
+
,
FS (fractional standard deviations) = (
) 0 . 5 (
)
o
p
o
p
σ − σ
σ + σ ,
TABLE 7.1
Statistical Evaluation of Model Results for the
Steady-State, Two-Dimensional Advection–
Diffusion for Fickian Flows, Copenhagen
Experiment (Crosswind Integrated
Concentrations), Eddy Diffusivity Equation 7.23,
and Similarity Wind Profi le
Model
NMSE
COR
FA2
FB
FS
GILTT
0.06
0.92
1.0
−0.14
−0.02
Gaussian
0.08
0.87
1.0
0.10
0.31
ADMM
0.06
0.89
1.0
0.02
0.09
© 2010 by Taylor and Francis Group, LLC
Air Pollution and Turbulence: Modeling and Applications
ground-level positions at the maximum of three crosswind arcs. The sampling units
were positioned at 2–6 km from the point of release. The site was mainly residential
with a roughness length of 0.6 m.
In the Prairie–Grass experiment, according to Barad (1958), the tracer SO 2 was
released without buoyancy at a height of 0.46 m, and collected at a height of 1.5 m
at fi ve downwind distances (50, 100, 200, 400, and 800 m) at O’Neill, Nebraska in
1956. The Prairie-Grass site was quite fl at and much smooth with a roughness length
of 0.6 cm. In this chapter, we consider the experimental data appearing in the paper
of Nieuwstadt (1980).
Experiments of pollutant dispersion under low wind conditions were done at
Indian Institute of Technology and described by Sharan et al. (1996a,b; 2002). The
contaminant was released without buoyancy at a height of 1 m and the concentration
measured near the ground (0.5 m). The emission rate of the SF 6 tracer ranged from
30 to 50 mL/min. The sample period for each experiment was 30 min. The wind and
temperature were measured at four heights (2, 4, 15, and 30 m) from a meteorological
tower of 30 m. The samplers were positioned in arcs with radius of 50 and 100 m with
a source distance of 100 m.
7.5 APPLICATIONS
Next we report the numerical results attained by the GILTT formulation for the discussed solutions. Tables 7.1 through 7.5 present some performance evaluations of the
model results for the above experiments, using the statistical evaluation procedure
described by Hanna (1989) and defi ned in the following way:
NMSE (normalized mean square error) =
2
(
)
o
p
p o
C C
C C
−
,
FA2 = fraction of data (%, normalized to 1) for 0.5 ≤ (C p /C o ) ≤ 2,
COR (correlation coeffi cient) = (
) (
o
o
p
p
o p
C C C C
−
−
σσ ,
FB (fractional bias) =
0.5(
)
o
p
o
p
C C
C C
−
+
,
FS (fractional standard deviations) = (
) 0 . 5 (
)
o
p
o
p
σ − σ
σ + σ ,
TABLE 7.1
Statistical Evaluation of Model Results for the
Steady-State, Two-Dimensional Advection–
Diffusion for Fickian Flows, Copenhagen
Experiment (Crosswind Integrated
Concentrations), Eddy Diffusivity Equation 7.23,
and Similarity Wind Profi le
Model
NMSE
COR
FA2
FB
FS
GILTT
0.06
0.92
1.0
−0.14
−0.02
Gaussian
0.08
0.87
1.0
0.10
0.31
ADMM
0.06
0.89
1.0
0.02
0.09
© 2010 by Taylor and Francis Group, LLC