

Pollutant Dispersion Simulation in the ABL by the GILTT Method
193
where the subscripts o and p refer to observed and predicted quantities, respectively,
and the overbar indicates an averaged value. The statistical index FB says if the
predicted quantities underestimate or overestimate the observed ones. The statistical
index NMSE represents the model values dispersion in respect to data dispersion.
The best results are expected to have values near to zero for the indices NMSE, FB,
and FS, and near to one in the indices COR and FA2.
7.5.1 COPENHAGEN EXPERIMENT RESULTS
Table 7.1 shows the performance of the solution of the steady-state, 2D advection–
diffusion for Fickian fl ows, compared with other models considering similarity wind
profi le and using crosswind integrated ground-level concentration (2D-dataset). The
results obtained are presented and compared with other models (Degrazia, 1998b;
Mangia et al., 2002). The eddy diffusivity Equation 7.23 was used. The statistical indices of the three tables point out that a good agreement is obtained between
experimental data and the GILTT method. Analyzing the statistical indices (Hanna,
1989), we notice that these models simulate satisfactorily the observed concentrations, regarding the NMSE, FB, and FS values relatively near to zero and COR
relatively near to 1.
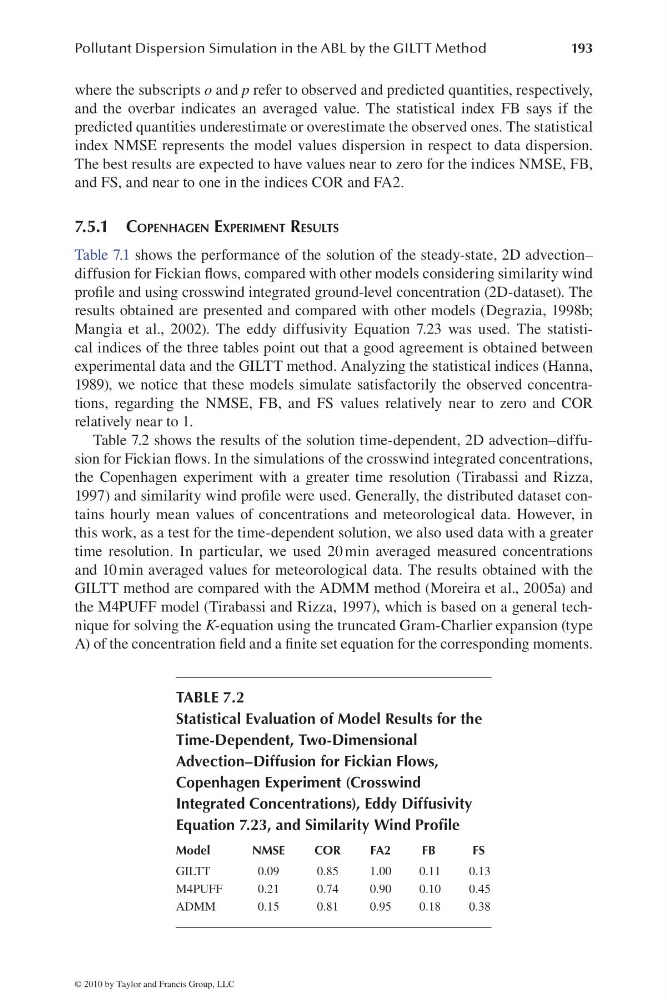
Table 7.2 shows the results of the solution time-dependent, 2D advection–diffusion for Fickian fl ows. In the simulations of the crosswind integrated concentrations,
the Copenhagen experiment with a greater time resolution (Tirabassi and Rizza,
1997) and similarity wind profi le were used. Generally, the distributed dataset contains hourly mean values of concentrations and meteorological data. However, in
this work, as a test for the time-dependent solution, we also used data with a greater
time resolution. In particular, we used 20 min averaged measured concentrations
and 10 min averaged values for meteorological data. The results obtained with the
GILTT method are compared with the ADMM method (Moreira et al., 2005a) and
the M4PUFF model (Tirabassi and Rizza, 1997), which is based on a general technique for solving the K-equation using the truncated Gram-Charlier expansion (type
A) of the concentration fi eld and a fi nite set equation for the corresponding moments.
TABLE 7.2
Statistical Evaluation of Model Results for the
Time-Dependent, Two-Dimensional
Advection–Diffusion for Fickian Flows,
Copenhagen Experiment (Crosswind
Integrated Concentrations), Eddy Diffusivity
Equation 7.23, and Similarity Wind Profi le
Model
NMSE
COR
FA2
FB
FS
GILTT
0.09
0.85
1.00
0.11
0.13
M4PUFF
0.21
0.74
0.90
0.10
0.45
ADMM
0.15
0.81
0.95
0.18
0.38
© 2010 by Taylor and Francis Group, LLC
193
where the subscripts o and p refer to observed and predicted quantities, respectively,
and the overbar indicates an averaged value. The statistical index FB says if the
predicted quantities underestimate or overestimate the observed ones. The statistical
index NMSE represents the model values dispersion in respect to data dispersion.
The best results are expected to have values near to zero for the indices NMSE, FB,
and FS, and near to one in the indices COR and FA2.
7.5.1 COPENHAGEN EXPERIMENT RESULTS
Table 7.1 shows the performance of the solution of the steady-state, 2D advection–
diffusion for Fickian fl ows, compared with other models considering similarity wind
profi le and using crosswind integrated ground-level concentration (2D-dataset). The
results obtained are presented and compared with other models (Degrazia, 1998b;
Mangia et al., 2002). The eddy diffusivity Equation 7.23 was used. The statistical indices of the three tables point out that a good agreement is obtained between
experimental data and the GILTT method. Analyzing the statistical indices (Hanna,
1989), we notice that these models simulate satisfactorily the observed concentrations, regarding the NMSE, FB, and FS values relatively near to zero and COR
relatively near to 1.
Table 7.2 shows the results of the solution time-dependent, 2D advection–diffusion for Fickian fl ows. In the simulations of the crosswind integrated concentrations,
the Copenhagen experiment with a greater time resolution (Tirabassi and Rizza,
1997) and similarity wind profi le were used. Generally, the distributed dataset contains hourly mean values of concentrations and meteorological data. However, in
this work, as a test for the time-dependent solution, we also used data with a greater
time resolution. In particular, we used 20 min averaged measured concentrations
and 10 min averaged values for meteorological data. The results obtained with the
GILTT method are compared with the ADMM method (Moreira et al., 2005a) and
the M4PUFF model (Tirabassi and Rizza, 1997), which is based on a general technique for solving the K-equation using the truncated Gram-Charlier expansion (type
A) of the concentration fi eld and a fi nite set equation for the corresponding moments.
TABLE 7.2
Statistical Evaluation of Model Results for the
Time-Dependent, Two-Dimensional
Advection–Diffusion for Fickian Flows,
Copenhagen Experiment (Crosswind
Integrated Concentrations), Eddy Diffusivity
Equation 7.23, and Similarity Wind Profi le
Model
NMSE
COR
FA2
FB
FS
GILTT
0.09
0.85
1.00
0.11
0.13
M4PUFF
0.21
0.74
0.90
0.10
0.45
ADMM
0.15
0.81
0.95
0.18
0.38
© 2010 by Taylor and Francis Group, LLC