

144
Air Pollution and Turbulence: Modeling and Applications
and, at night, cloud cover. Other techniques adopt measurements of the standard
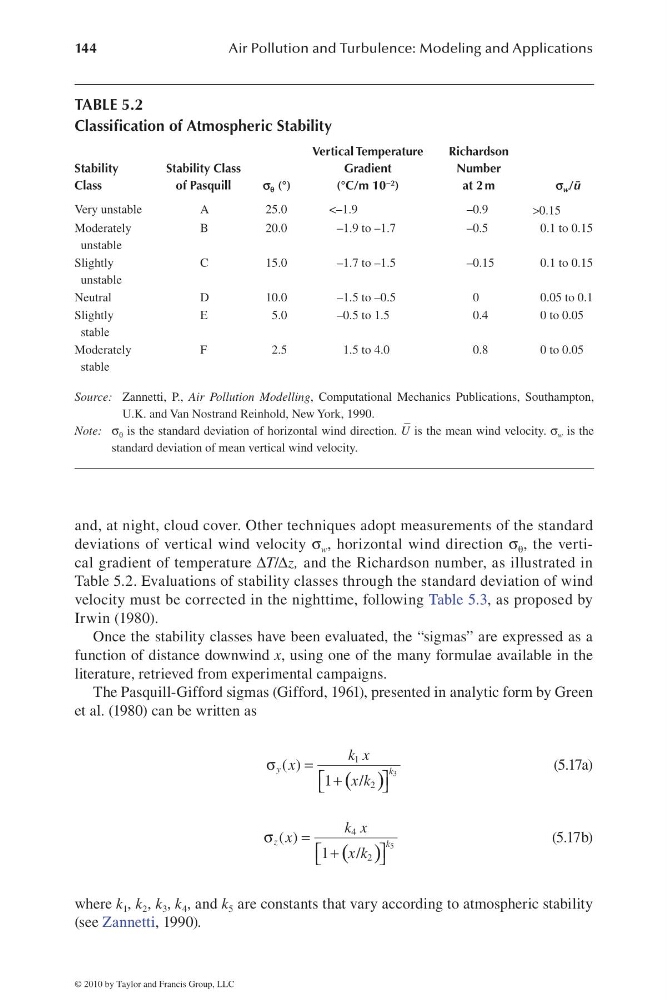
deviations of vertical wind velocity σ w , horizontal wind direction σ θ , the vertical gradient of temperature ΔT/Δz, and the Richardson number, as illustrated in
Table 5.2. Evaluations of stability classes through the standard deviation of wind
velocity must be corrected in the nighttime, following Table 5.3, as proposed by
Irwin (1980).
Once the stability classes have been evaluated, the “sigmas” are expressed as a
function of distance downwind x, using one of the many formulae available in the
literature, retrieved from experimental campaigns.
The Pasquill-Gifford sigmas (Gifford, 1961), presented in analytic form by Green
et al. (1980) can be written as
( )
σ
= ⎡
⎤
+
⎣
⎦
3
1
2
( )
1
/
y
k
k x
x
x k
(5.17a)
( )
σ
= ⎡
⎤
+
⎣
⎦
5
4
2
( )
1
/
z
k
k x
x
x k
(5.17b)
where k 1 , k 2 , k 3 , k 4 , and k 5 are constants that vary according to atmospheric stability
(see Zannetti, 1990).
TABLE 5.2
Classifi cation of Atmospheric Stability
Stability
Class
Stability Class
of Pasquill
s q (°)
Vertical Temperature
Gradient
(°C/m 10 −2 )
Richardson
Number
at 2 m
s w /u ¯
Very unstable
A
25.0
<–1.9
–0.9
>0.15
Moderately
unstable
B
20.0
–1.9 to –1.7
–0.5
0.1 to 0.15
Slightly
unstable
C
15.0
–1.7 to –1.5
–0.15
0.1 to 0.15
Neutral
D
10.0
–1.5 to –0.5
0
0.05 to 0.1
Slightly
stable
E
5.0
–0.5 to 1.5
0.4
0 to 0.05
Moderately
stable
F
2.5
1.5 to 4.0
0.8
0 to 0.05
Source: Zannetti, P., Air Pollution Modelling, Computational Mechanics Publications, Southampton,
U.K. and Van Nostrand Reinhold, New York, 1990.
Note: σ θ is the standard deviation of horizontal wind direction. U
– is the mean wind velocity. σ w is the
standard deviation of mean vertical wind velocity.
© 2010 by Taylor and Francis Group, LLC
Air Pollution and Turbulence: Modeling and Applications
and, at night, cloud cover. Other techniques adopt measurements of the standard
deviations of vertical wind velocity σ w , horizontal wind direction σ θ , the vertical gradient of temperature ΔT/Δz, and the Richardson number, as illustrated in
Table 5.2. Evaluations of stability classes through the standard deviation of wind
velocity must be corrected in the nighttime, following Table 5.3, as proposed by
Irwin (1980).
Once the stability classes have been evaluated, the “sigmas” are expressed as a
function of distance downwind x, using one of the many formulae available in the
literature, retrieved from experimental campaigns.
The Pasquill-Gifford sigmas (Gifford, 1961), presented in analytic form by Green
et al. (1980) can be written as
( )
σ
= ⎡
⎤
+
⎣
⎦
3
1
2
( )
1
/
y
k
k x
x
x k
(5.17a)
( )
σ
= ⎡
⎤
+
⎣
⎦
5
4
2
( )
1
/
z
k
k x
x
x k
(5.17b)
where k 1 , k 2 , k 3 , k 4 , and k 5 are constants that vary according to atmospheric stability
(see Zannetti, 1990).
TABLE 5.2
Classifi cation of Atmospheric Stability
Stability
Class
Stability Class
of Pasquill
s q (°)
Vertical Temperature
Gradient
(°C/m 10 −2 )
Richardson
Number
at 2 m
s w /u ¯
Very unstable
A
25.0
<–1.9
–0.9
>0.15
Moderately
unstable
B
20.0
–1.9 to –1.7
–0.5
0.1 to 0.15
Slightly
unstable
C
15.0
–1.7 to –1.5
–0.15
0.1 to 0.15
Neutral
D
10.0
–1.5 to –0.5
0
0.05 to 0.1
Slightly
stable
E
5.0
–0.5 to 1.5
0.4
0 to 0.05
Moderately
stable
F
2.5
1.5 to 4.0
0.8
0 to 0.05
Source: Zannetti, P., Air Pollution Modelling, Computational Mechanics Publications, Southampton,
U.K. and Van Nostrand Reinhold, New York, 1990.
Note: σ θ is the standard deviation of horizontal wind direction. U
– is the mean wind velocity. σ w is the
standard deviation of mean vertical wind velocity.
© 2010 by Taylor and Francis Group, LLC