

exceeding their ERL values. All stations exceed the ERL value for As but
no station exceed the ERL value for Cd. Only three stations (S20, S35
and S43) exceed the ERM for Ni, which indicate that this metal can
have an effect, but it must be noted that these stations are absolutely
not in the same area. The mean concentrations of Cd, Pb and Zn are
lower than the TEL values (adverse effects are expected to occur only
rarely), while Cr, Cu, Ni and As are above (associated adverse biological
effects may occasionally occur (Fig. 5b) (Canadian Council of Ministers
of the Environment, 1999). The concentrations of Cr, Ni, Cu, Pb and Zn
exceed TEL values for 86%, 84%, 60%, 33%, and 25% of the samples.
As for ERL, all stations exceeds the TEL of As and no station exceeds the
TEL value of Cd. There are four stations where Cr and As exceed their
PEL (probable effect level) values, and nine stations for Ni. The concentrations of other metals (Cu, Zn, Pb and Cd) are all below their PEL
values.
The m-ERM-Q calculated based on Cd, Cr, Cu, Ni, Pb, As and Zn
ranged from 0.06 to 0.44 with a mean value of 0.24, i.e. a 30% probability of being toxic. Only three stations have ERM-Q (< 0.1) and are
categorized as non toxic. The rest of the 48 stations are slightly toxic
(Fig. 6a).
The m-PEL-Q range from 0.1 to 0.73 with a mean value of 0.39,
indicating that the combination of Cd, Cr, Cu, Ni, Pb, As and Zn may
have a 40% probability of being toxic. Only one station (S01) have PELQ (< 0.1) and is categorized as non toxic, the other 50 stations are
slightly toxic (Fig. 6b).
The values of the sum of TUs for each station based on the concentrations of Cd, Cr, As, Cu, Ni, Pb and Zn range from 0.71 to 5.08
with a mean of 2.74 (Fig.6c). The sum of the toxic unit in S20 located at
Beni Saf in the Western area of Algerian coast exhibit the highest level,
while the minimum is at station S01 located also at Beni Saf. The
contribution rate of every heavy metal to the ∑TUs is shown in Fig. 7.
The maximum contribution is due to Ni, followed by Cr and As. It is
important to note that the influence of Ni and Cr on the TU values is
probably mainly related to their rather low PEL values, and not to an
important anthropogenic sources. As shown before, they can be considered as natural along the coast according to the various geochemical
indexes. Another argument against the low PEL threesholds is that,
according to the other values reported Table 4, Cr and Ni will have an
influence on TU for many sediments of the Mediterranean Sea, which is
not realistic. Nevertheless, due to the important contribution of Ni in
the sum of TUs, and given its carcinogenic character (Homady et al.,
2002), the inputs of this metal in the marine environment should be
better monitored, and its real toxicity should be questioned.
7. Conclusion
This study allowed us to characterize for the first time the extent of
heavy metals contamination in the surface sediments of the entire
Algerian coast. The stations were choose in relation with the main
fishing areas, and they were not related to specific areas of pollution.
Our results revealed that As is the only metal that could be associated to anthropogenic inputs at this scale, the other ones being mainly
natural, with few local exceptions. The mean concentrations of Cr, Ni
and As in most of the stations are higher than the lowest thresholds of
sediment guidelines (ERL). Copper, Zn, Cd and Pb concentrations are all
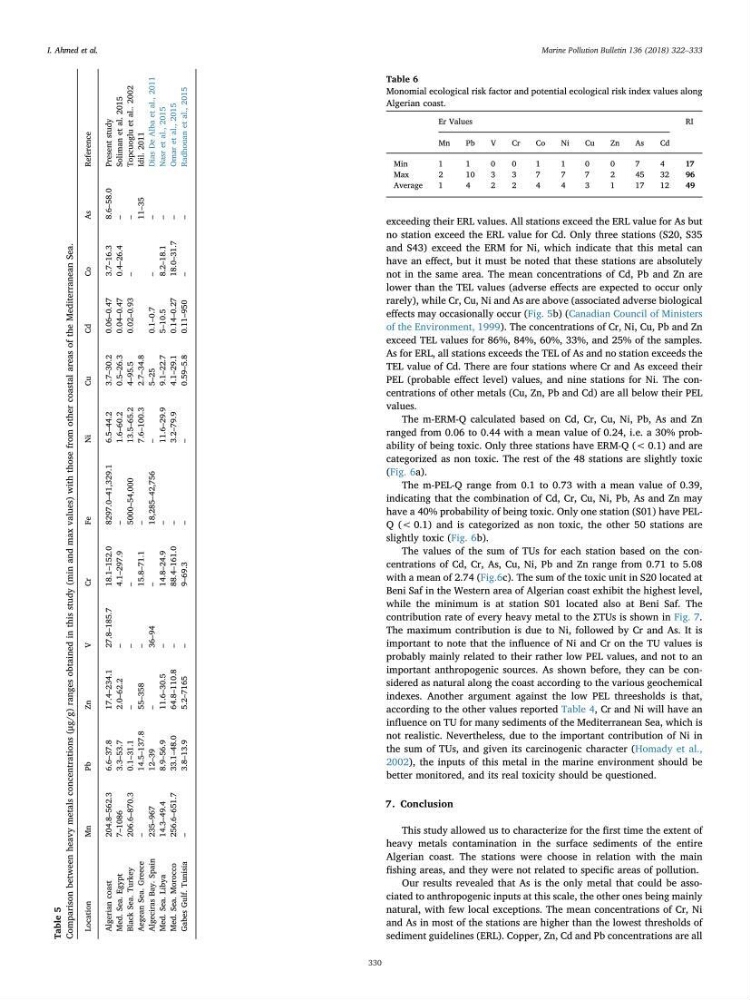
Table 5
Comparison between heavy metals concentrations (μg/g) ranges obtained in this study (min and max values) with those from other coastal areas of the Mediterranean Sea.
Location
Mn
Pb
Zn
V
Cr
Fe
Ni
Cu
Cd
Co
As
Reference
Algerian coast
204.8–562.3
6.6–37.8
17.4–234.1
27.8–185.7
18.1–152.0
8297.0–41,329.1
6.5–44.2
3.7–30.2
0.06–0.47
3.7–16.3
8.6–58.0
Present study
Med. Sea. Egypt
7–1086
3.3–53.7
2.0–62.2
–
4.1–297.9
–
1.6–60.2
0.5–26.3
0.04–0.47
0.4–26.4
–
Soliman et al. 2015
Black Sea. Turkey
206.6–870.3
0.1–31.1
–
–
–
5000–54,000
13.5–65.2
4–95.5
0.02–0.93
–
–
Topcuoglu et al.. 2002
Aegean Sea. Greece
–
14.5–137.8
55–358
–
15.8–71.1
–
7.6–100.3
2.7–34.8
11–35
Idil. 2011
Algeciras Bay. Spain
235–967
12–39
–
36–94
–
18,285–42,756
–
5–25
0.1–0.7
–
–
Dias
De Alba et al., 2011
Med. Sea. Libya
14.3–49.4
8.9–56.9
11.6–30.5
–
14.8–24.9
–
11.6–29.9
9.1–22.7
5–10.5
8.2–18.1
–
Nasr et al., 2015
Med. Sea. Morocco
256.6–651.7
33.1–48.0
64.8–110.8
–
88.4–161.0
–
3.2–79.9
4.1–29.1
0.14–0.27
18.0–31.7
–
Omar et al., 2015
Gabes Gulf. Tunisia
–
3.8–13.9
5.2–7165
–
9–69.3
–
–
0.59–5.8
0.11–950
–
–
Radhouan et al., 2015
Table 6
Monomial ecological risk factor and potential ecological risk index values along
Algerian coast.
Er Values
RI
Mn
Pb
V
Cr
Co
Ni
Cu
Zn
As
Cd
Min
1
1
0
0
1
1
0
0
7
4
17
Max
2
10
3
3
7
7
7
2
45
32
96
Average
1
4
2
2
4
4
3
1
17
12
49
I. Ahmed et al.
Marine Pollution Bulletin 136 (2018) 322–333
330
no station exceed the ERL value for Cd. Only three stations (S20, S35
and S43) exceed the ERM for Ni, which indicate that this metal can
have an effect, but it must be noted that these stations are absolutely
not in the same area. The mean concentrations of Cd, Pb and Zn are
lower than the TEL values (adverse effects are expected to occur only
rarely), while Cr, Cu, Ni and As are above (associated adverse biological
effects may occasionally occur (Fig. 5b) (Canadian Council of Ministers
of the Environment, 1999). The concentrations of Cr, Ni, Cu, Pb and Zn
exceed TEL values for 86%, 84%, 60%, 33%, and 25% of the samples.
As for ERL, all stations exceeds the TEL of As and no station exceeds the
TEL value of Cd. There are four stations where Cr and As exceed their
PEL (probable effect level) values, and nine stations for Ni. The concentrations of other metals (Cu, Zn, Pb and Cd) are all below their PEL
values.
The m-ERM-Q calculated based on Cd, Cr, Cu, Ni, Pb, As and Zn
ranged from 0.06 to 0.44 with a mean value of 0.24, i.e. a 30% probability of being toxic. Only three stations have ERM-Q (< 0.1) and are
categorized as non toxic. The rest of the 48 stations are slightly toxic
(Fig. 6a).
The m-PEL-Q range from 0.1 to 0.73 with a mean value of 0.39,
indicating that the combination of Cd, Cr, Cu, Ni, Pb, As and Zn may
have a 40% probability of being toxic. Only one station (S01) have PELQ (< 0.1) and is categorized as non toxic, the other 50 stations are
slightly toxic (Fig. 6b).
The values of the sum of TUs for each station based on the concentrations of Cd, Cr, As, Cu, Ni, Pb and Zn range from 0.71 to 5.08
with a mean of 2.74 (Fig.6c). The sum of the toxic unit in S20 located at
Beni Saf in the Western area of Algerian coast exhibit the highest level,
while the minimum is at station S01 located also at Beni Saf. The
contribution rate of every heavy metal to the ∑TUs is shown in Fig. 7.
The maximum contribution is due to Ni, followed by Cr and As. It is
important to note that the influence of Ni and Cr on the TU values is
probably mainly related to their rather low PEL values, and not to an
important anthropogenic sources. As shown before, they can be considered as natural along the coast according to the various geochemical
indexes. Another argument against the low PEL threesholds is that,
according to the other values reported Table 4, Cr and Ni will have an
influence on TU for many sediments of the Mediterranean Sea, which is
not realistic. Nevertheless, due to the important contribution of Ni in
the sum of TUs, and given its carcinogenic character (Homady et al.,
2002), the inputs of this metal in the marine environment should be
better monitored, and its real toxicity should be questioned.
7. Conclusion
This study allowed us to characterize for the first time the extent of
heavy metals contamination in the surface sediments of the entire
Algerian coast. The stations were choose in relation with the main
fishing areas, and they were not related to specific areas of pollution.
Our results revealed that As is the only metal that could be associated to anthropogenic inputs at this scale, the other ones being mainly
natural, with few local exceptions. The mean concentrations of Cr, Ni
and As in most of the stations are higher than the lowest thresholds of
sediment guidelines (ERL). Copper, Zn, Cd and Pb concentrations are all
Table 5
Comparison between heavy metals concentrations (μg/g) ranges obtained in this study (min and max values) with those from other coastal areas of the Mediterranean Sea.
Location
Mn
Pb
Zn
V
Cr
Fe
Ni
Cu
Cd
Co
As
Reference
Algerian coast
204.8–562.3
6.6–37.8
17.4–234.1
27.8–185.7
18.1–152.0
8297.0–41,329.1
6.5–44.2
3.7–30.2
0.06–0.47
3.7–16.3
8.6–58.0
Present study
Med. Sea. Egypt
7–1086
3.3–53.7
2.0–62.2
–
4.1–297.9
–
1.6–60.2
0.5–26.3
0.04–0.47
0.4–26.4
–
Soliman et al. 2015
Black Sea. Turkey
206.6–870.3
0.1–31.1
–
–
–
5000–54,000
13.5–65.2
4–95.5
0.02–0.93
–
–
Topcuoglu et al.. 2002
Aegean Sea. Greece
–
14.5–137.8
55–358
–
15.8–71.1
–
7.6–100.3
2.7–34.8
11–35
Idil. 2011
Algeciras Bay. Spain
235–967
12–39
–
36–94
–
18,285–42,756
–
5–25
0.1–0.7
–
–
Dias
De Alba et al., 2011
Med. Sea. Libya
14.3–49.4
8.9–56.9
11.6–30.5
–
14.8–24.9
–
11.6–29.9
9.1–22.7
5–10.5
8.2–18.1
–
Nasr et al., 2015
Med. Sea. Morocco
256.6–651.7
33.1–48.0
64.8–110.8
–
88.4–161.0
–
3.2–79.9
4.1–29.1
0.14–0.27
18.0–31.7
–
Omar et al., 2015
Gabes Gulf. Tunisia
–
3.8–13.9
5.2–7165
–
9–69.3
–
–
0.59–5.8
0.11–950
–
–
Radhouan et al., 2015
Table 6
Monomial ecological risk factor and potential ecological risk index values along
Algerian coast.
Er Values
RI
Mn
Pb
V
Cr
Co
Ni
Cu
Zn
As
Cd
Min
1
1
0
0
1
1
0
0
7
4
17
Max
2
10
3
3
7
7
7
2
45
32
96
Average
1
4
2
2
4
4
3
1
17
12
49
I. Ahmed et al.
Marine Pollution Bulletin 136 (2018) 322–333
330