

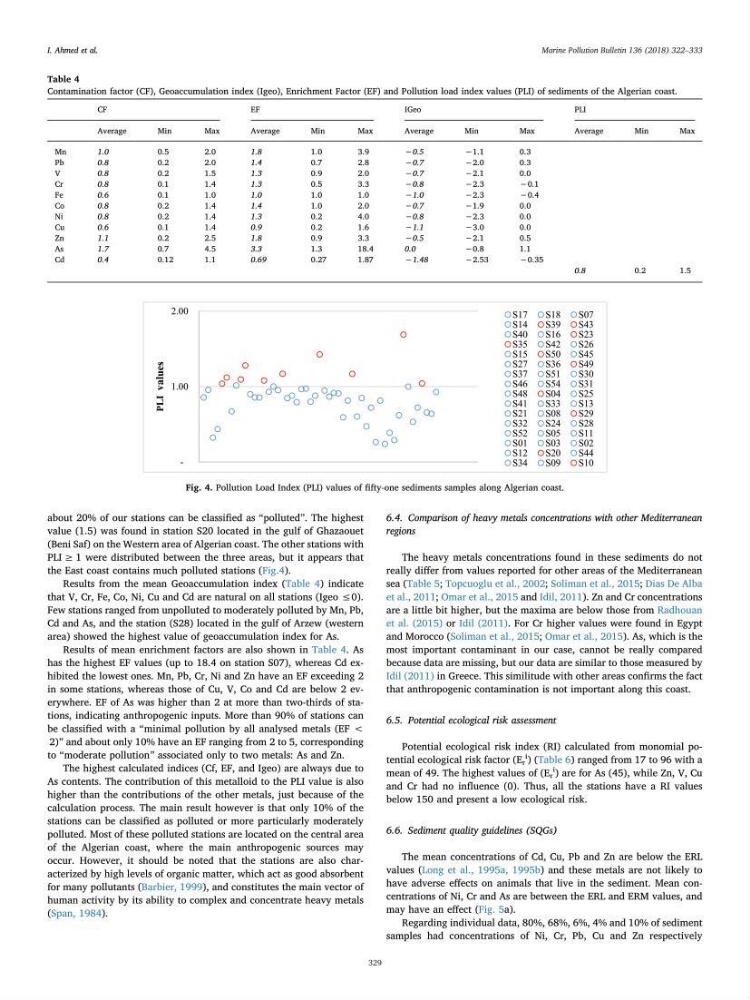
about 20% of our stations can be classified as “polluted”. The highest
value (1.5) was found in station S20 located in the gulf of Ghazaouet
(Beni Saf) on the Western area of Algerian coast. The other stations with
PLI ≥ 1 were distributed between the three areas, but it appears that
the East coast contains much polluted stations (Fig.4).
Results from the mean Geoaccumulation index (Table 4) indicate
that V, Cr, Fe, Co, Ni, Cu and Cd are natural on all stations (Igeo ≤0).
Few stations ranged from unpolluted to moderately polluted by Mn, Pb,
Cd and As, and the station (S28) located in the gulf of Arzew (western
area) showed the highest value of geoaccumulation index for As.
Results of mean enrichment factors are also shown in Table 4. As
has the highest EF values (up to 18.4 on station S07), whereas Cd exhibited the lowest ones. Mn, Pb, Cr, Ni and Zn have an EF exceeding 2
in some stations, whereas those of Cu, V, Co and Cd are below 2 everywhere. EF of As was higher than 2 at more than two-thirds of stations, indicating anthropogenic inputs. More than 90% of stations can
be classified with a “minimal pollution by all analysed metals (EF <
2)” and about only 10% have an EF ranging from 2 to 5, corresponding
to “moderate pollution” associated only to two metals: As and Zn.
The highest calculated indices (Cf, EF, and Igeo) are always due to
As contents. The contribution of this metalloid to the PLI value is also
higher than the contributions of the other metals, just because of the
calculation process. The main result however is that only 10% of the
stations can be classified as polluted or more particularly moderately
polluted. Most of these polluted stations are located on the central area
of the Algerian coast, where the main anthropogenic sources may
occur. However, it should be noted that the stations are also characterized by high levels of organic matter, which act as good absorbent
for many pollutants (Barbier, 1999), and constitutes the main vector of
human activity by its ability to complex and concentrate heavy metals
(Span, 1984).
6.4. Comparison of heavy metals concentrations with other Mediterranean
regions
The heavy metals concentrations found in these sediments do not
really differ from values reported for other areas of the Mediterranean
sea (Table 5; Topcuoglu et al., 2002; Soliman et al., 2015; Dias De Alba
et al., 2011; Omar et al., 2015 and Idil, 2011). Zn and Cr concentrations
are a little bit higher, but the maxima are below those from Radhouan
et al. (2015) or Idil (2011). For Cr higher values were found in Egypt
and Morocco (Soliman et al., 2015; Omar et al., 2015). As, which is the
most important contaminant in our case, cannot be really compared
because data are missing, but our data are similar to those measured by
Idil (2011) in Greece. This similitude with other areas confirms the fact
that anthropogenic contamination is not important along this coast.
6.5. Potential ecological risk assessment
Potential ecological risk index (RI) calculated from monomial potential ecological risk factor (E r
i ) (Table 6) ranged from 17 to 96 with a
mean of 49. The highest values of (E r
i ) are for As (45), while Zn, V, Cu
and Cr had no influence (0). Thus, all the stations have a RI values
below 150 and present a low ecological risk.
6.6. Sediment quality guidelines (SQGs)
The mean concentrations of Cd, Cu, Pb and Zn are below the ERL
values (Long et al., 1995a, 1995b) and these metals are not likely to
have adverse effects on animals that live in the sediment. Mean concentrations of Ni, Cr and As are between the ERL and ERM values, and
may have an effect (Fig. 5a).
Regarding individual data, 80%, 68%, 6%, 4% and 10% of sediment
samples had concentrations of Ni, Cr, Pb, Cu and Zn respectively
Table 4
Contamination factor (CF), Geoaccumulation index (Igeo), Enrichment Factor (EF) and Pollution load index values (PLI) of sediments of the Algerian coast.
CF
EF
IGeo
PLI
Average
Min
Max
Average
Min
Max
Average
Min
Max
Average
Min
Max
Mn
1.0
0.5
2.0
1.8
1.0
3.9
−0.5
−1.1
0.3
Pb
0.8
0.2
2.0
1.4
0.7
2.8
−0.7
−2.0
0.3
V
0.8
0.2
1.5
1.3
0.9
2.0
−0.7
−2.1
0.0
Cr
0.8
0.1
1.4
1.3
0.5
3.3
−0.8
−2.3
−0.1
Fe
0.6
0.1
1.0
1.0
1.0
1.0
−1.0
−2.3
−0.4
Co
0.8
0.2
1.4
1.4
1.0
2.0
−0.7
−1.9
0.0
Ni
0.8
0.2
1.4
1.3
0.2
4.0
−0.8
−2.3
0.0
Cu
0.6
0.1
1.4
0.9
0.2
1.6
−1.1
−3.0
0.0
Zn
1.1
0.2
2.5
1.8
0.9
3.3
−0.5
−2.1
0.5
As
1.7
0.7
4.5
3.3
1.3
18.4
0.0
−0.8
1.1
Cd
0.4
0.12
1.1
0.69
0.27
1.87
−1.48
−2.53
−0.35
0.8
0.2
1.5
Fig. 4. Pollution Load Index (PLI) values of fifty-one sediments samples along Algerian coast.
I. Ahmed et al.
Marine Pollution Bulletin 136 (2018) 322–333
329
value (1.5) was found in station S20 located in the gulf of Ghazaouet
(Beni Saf) on the Western area of Algerian coast. The other stations with
PLI ≥ 1 were distributed between the three areas, but it appears that
the East coast contains much polluted stations (Fig.4).
Results from the mean Geoaccumulation index (Table 4) indicate
that V, Cr, Fe, Co, Ni, Cu and Cd are natural on all stations (Igeo ≤0).
Few stations ranged from unpolluted to moderately polluted by Mn, Pb,
Cd and As, and the station (S28) located in the gulf of Arzew (western
area) showed the highest value of geoaccumulation index for As.
Results of mean enrichment factors are also shown in Table 4. As
has the highest EF values (up to 18.4 on station S07), whereas Cd exhibited the lowest ones. Mn, Pb, Cr, Ni and Zn have an EF exceeding 2
in some stations, whereas those of Cu, V, Co and Cd are below 2 everywhere. EF of As was higher than 2 at more than two-thirds of stations, indicating anthropogenic inputs. More than 90% of stations can
be classified with a “minimal pollution by all analysed metals (EF <
2)” and about only 10% have an EF ranging from 2 to 5, corresponding
to “moderate pollution” associated only to two metals: As and Zn.
The highest calculated indices (Cf, EF, and Igeo) are always due to
As contents. The contribution of this metalloid to the PLI value is also
higher than the contributions of the other metals, just because of the
calculation process. The main result however is that only 10% of the
stations can be classified as polluted or more particularly moderately
polluted. Most of these polluted stations are located on the central area
of the Algerian coast, where the main anthropogenic sources may
occur. However, it should be noted that the stations are also characterized by high levels of organic matter, which act as good absorbent
for many pollutants (Barbier, 1999), and constitutes the main vector of
human activity by its ability to complex and concentrate heavy metals
(Span, 1984).
6.4. Comparison of heavy metals concentrations with other Mediterranean
regions
The heavy metals concentrations found in these sediments do not
really differ from values reported for other areas of the Mediterranean
sea (Table 5; Topcuoglu et al., 2002; Soliman et al., 2015; Dias De Alba
et al., 2011; Omar et al., 2015 and Idil, 2011). Zn and Cr concentrations
are a little bit higher, but the maxima are below those from Radhouan
et al. (2015) or Idil (2011). For Cr higher values were found in Egypt
and Morocco (Soliman et al., 2015; Omar et al., 2015). As, which is the
most important contaminant in our case, cannot be really compared
because data are missing, but our data are similar to those measured by
Idil (2011) in Greece. This similitude with other areas confirms the fact
that anthropogenic contamination is not important along this coast.
6.5. Potential ecological risk assessment
Potential ecological risk index (RI) calculated from monomial potential ecological risk factor (E r
i ) (Table 6) ranged from 17 to 96 with a
mean of 49. The highest values of (E r
i ) are for As (45), while Zn, V, Cu
and Cr had no influence (0). Thus, all the stations have a RI values
below 150 and present a low ecological risk.
6.6. Sediment quality guidelines (SQGs)
The mean concentrations of Cd, Cu, Pb and Zn are below the ERL
values (Long et al., 1995a, 1995b) and these metals are not likely to
have adverse effects on animals that live in the sediment. Mean concentrations of Ni, Cr and As are between the ERL and ERM values, and
may have an effect (Fig. 5a).
Regarding individual data, 80%, 68%, 6%, 4% and 10% of sediment
samples had concentrations of Ni, Cr, Pb, Cu and Zn respectively
Table 4
Contamination factor (CF), Geoaccumulation index (Igeo), Enrichment Factor (EF) and Pollution load index values (PLI) of sediments of the Algerian coast.
CF
EF
IGeo
PLI
Average
Min
Max
Average
Min
Max
Average
Min
Max
Average
Min
Max
Mn
1.0
0.5
2.0
1.8
1.0
3.9
−0.5
−1.1
0.3
Pb
0.8
0.2
2.0
1.4
0.7
2.8
−0.7
−2.0
0.3
V
0.8
0.2
1.5
1.3
0.9
2.0
−0.7
−2.1
0.0
Cr
0.8
0.1
1.4
1.3
0.5
3.3
−0.8
−2.3
−0.1
Fe
0.6
0.1
1.0
1.0
1.0
1.0
−1.0
−2.3
−0.4
Co
0.8
0.2
1.4
1.4
1.0
2.0
−0.7
−1.9
0.0
Ni
0.8
0.2
1.4
1.3
0.2
4.0
−0.8
−2.3
0.0
Cu
0.6
0.1
1.4
0.9
0.2
1.6
−1.1
−3.0
0.0
Zn
1.1
0.2
2.5
1.8
0.9
3.3
−0.5
−2.1
0.5
As
1.7
0.7
4.5
3.3
1.3
18.4
0.0
−0.8
1.1
Cd
0.4
0.12
1.1
0.69
0.27
1.87
−1.48
−2.53
−0.35
0.8
0.2
1.5
Fig. 4. Pollution Load Index (PLI) values of fifty-one sediments samples along Algerian coast.
I. Ahmed et al.
Marine Pollution Bulletin 136 (2018) 322–333
329