

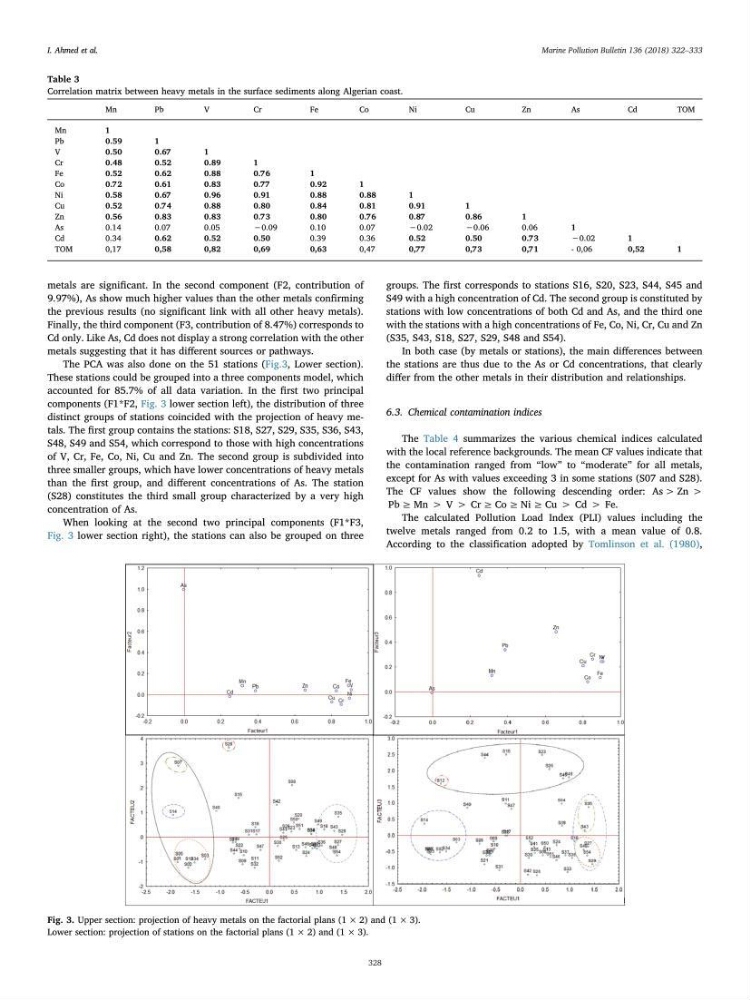
metals are significant. In the second component (F2, contribution of
9.97%), As show much higher values than the other metals confirming
the previous results (no significant link with all other heavy metals).
Finally, the third component (F3, contribution of 8.47%) corresponds to
Cd only. Like As, Cd does not display a strong correlation with the other
metals suggesting that it has different sources or pathways.
The PCA was also done on the 51 stations (Fig.3, Lower section).
These stations could be grouped into a three components model, which
accounted for 85.7% of all data variation. In the first two principal
components (F1*F2, Fig. 3 lower section left), the distribution of three
distinct groups of stations coincided with the projection of heavy metals. The first group contains the stations: S18, S27, S29, S35, S36, S43,
S48, S49 and S54, which correspond to those with high concentrations
of V, Cr, Fe, Co, Ni, Cu and Zn. The second group is subdivided into
three smaller groups, which have lower concentrations of heavy metals
than the first group, and different concentrations of As. The station
(S28) constitutes the third small group characterized by a very high
concentration of As.
When looking at the second two principal components (F1*F3,
Fig. 3 lower section right), the stations can also be grouped on three
groups. The first corresponds to stations S16, S20, S23, S44, S45 and
S49 with a high concentration of Cd. The second group is constituted by
stations with low concentrations of both Cd and As, and the third one
with the stations with a high concentrations of Fe, Co, Ni, Cr, Cu and Zn
(S35, S43, S18, S27, S29, S48 and S54).
In both case (by metals or stations), the main differences between
the stations are thus due to the As or Cd concentrations, that clearly
differ from the other metals in their distribution and relationships.
6.3. Chemical contamination indices
The Table 4 summarizes the various chemical indices calculated
with the local reference backgrounds. The mean CF values indicate that
the contamination ranged from “low” to “moderate” for all metals,
except for As with values exceeding 3 in some stations (S07 and S28).
The CF values show the following descending order: As > Zn >
Pb ≥ Mn > V > Cr ≥ Co ≥ Ni ≥ Cu > Cd > Fe.
The calculated Pollution Load Index (PLI) values including the
twelve metals ranged from 0.2 to 1.5, with a mean value of 0.8.
According to the classification adopted by Tomlinson et al. (1980),
Table 3
Correlation matrix between heavy metals in the surface sediments along Algerian coast.
Mn
Pb
V
Cr
Fe
Co
Ni
Cu
Zn
As
Cd
TOM
Mn
1
Pb
0.59
1
V
0.50
0.67
1
Cr
0.48
0.52
0.89
1
Fe
0.52
0.62
0.88
0.76
1
Co
0.72
0.61
0.83
0.77
0.92
1
Ni
0.58
0.67
0.96
0.91
0.88
0.88
1
Cu
0.52
0.74
0.88
0.80
0.84
0.81
0.91
1
Zn
0.56
0.83
0.83
0.73
0.80
0.76
0.87
0.86
1
As
0.14
0.07
0.05
−0.09
0.10
0.07
−0.02
−0.06
0.06
1
Cd
0.34
0.62
0.52
0.50
0.39
0.36
0.52
0.50
0.73
−0.02
1
TOM
0,17
0,58
0,82
0,69
0,63
0,47
0,77
0,73
0,71
- 0,06
0,52
1
Fig. 3. Upper section: projection of heavy metals on the factorial plans (1 × 2) and (1 × 3).
Lower section: projection of stations on the factorial plans (1 × 2) and (1 × 3).
I. Ahmed et al.
Marine Pollution Bulletin 136 (2018) 322–333
328
9.97%), As show much higher values than the other metals confirming
the previous results (no significant link with all other heavy metals).
Finally, the third component (F3, contribution of 8.47%) corresponds to
Cd only. Like As, Cd does not display a strong correlation with the other
metals suggesting that it has different sources or pathways.
The PCA was also done on the 51 stations (Fig.3, Lower section).
These stations could be grouped into a three components model, which
accounted for 85.7% of all data variation. In the first two principal
components (F1*F2, Fig. 3 lower section left), the distribution of three
distinct groups of stations coincided with the projection of heavy metals. The first group contains the stations: S18, S27, S29, S35, S36, S43,
S48, S49 and S54, which correspond to those with high concentrations
of V, Cr, Fe, Co, Ni, Cu and Zn. The second group is subdivided into
three smaller groups, which have lower concentrations of heavy metals
than the first group, and different concentrations of As. The station
(S28) constitutes the third small group characterized by a very high
concentration of As.
When looking at the second two principal components (F1*F3,
Fig. 3 lower section right), the stations can also be grouped on three
groups. The first corresponds to stations S16, S20, S23, S44, S45 and
S49 with a high concentration of Cd. The second group is constituted by
stations with low concentrations of both Cd and As, and the third one
with the stations with a high concentrations of Fe, Co, Ni, Cr, Cu and Zn
(S35, S43, S18, S27, S29, S48 and S54).
In both case (by metals or stations), the main differences between
the stations are thus due to the As or Cd concentrations, that clearly
differ from the other metals in their distribution and relationships.
6.3. Chemical contamination indices
The Table 4 summarizes the various chemical indices calculated
with the local reference backgrounds. The mean CF values indicate that
the contamination ranged from “low” to “moderate” for all metals,
except for As with values exceeding 3 in some stations (S07 and S28).
The CF values show the following descending order: As > Zn >
Pb ≥ Mn > V > Cr ≥ Co ≥ Ni ≥ Cu > Cd > Fe.
The calculated Pollution Load Index (PLI) values including the
twelve metals ranged from 0.2 to 1.5, with a mean value of 0.8.
According to the classification adopted by Tomlinson et al. (1980),
Table 3
Correlation matrix between heavy metals in the surface sediments along Algerian coast.
Mn
Pb
V
Cr
Fe
Co
Ni
Cu
Zn
As
Cd
TOM
Mn
1
Pb
0.59
1
V
0.50
0.67
1
Cr
0.48
0.52
0.89
1
Fe
0.52
0.62
0.88
0.76
1
Co
0.72
0.61
0.83
0.77
0.92
1
Ni
0.58
0.67
0.96
0.91
0.88
0.88
1
Cu
0.52
0.74
0.88
0.80
0.84
0.81
0.91
1
Zn
0.56
0.83
0.83
0.73
0.80
0.76
0.87
0.86
1
As
0.14
0.07
0.05
−0.09
0.10
0.07
−0.02
−0.06
0.06
1
Cd
0.34
0.62
0.52
0.50
0.39
0.36
0.52
0.50
0.73
−0.02
1
TOM
0,17
0,58
0,82
0,69
0,63
0,47
0,77
0,73
0,71
- 0,06
0,52
1
Fig. 3. Upper section: projection of heavy metals on the factorial plans (1 × 2) and (1 × 3).
Lower section: projection of stations on the factorial plans (1 × 2) and (1 × 3).
I. Ahmed et al.
Marine Pollution Bulletin 136 (2018) 322–333
328