

The maximum for Cr, Cu and As were respectively at S49 (bay of Jijel),
S04 (Algiers bay) and S28 (Arzew gulf). While, the minimum levels
were respectively at S01 (Beni Saf) for Pb, V, Cr and Cd, at S05 (Arzew
golf) for Mn, Co, Cu and Zn, at S07 (Elkala region) for Ni and at S02
(Beni Saf) for As.
An analysis of variance to one factor (ANOVA) was performed to
compare the concentrations of the three areas (East, Center and West).
The calculated P value is > 0.05 for V, Cr, Fe, Co, Ni, Cu and As, implying that the null hypothesis (H0) can be rejected. We can therefore
conclude that there is a significant difference between these heavy
metals in the three regions with a 95% safety levels. In contrast, Mn, Pb
and Zn do not differ (P lower than 0.05). Thus, the differences found are
between the West and the other two areas (East and Center) for V, Cr,
Fe, Ni and Cu (while, the difference was only between West and Center
for Co, and between West and East for As). Whatever the metal, the
Western area differ from the other parts of the Algerian coast., and the
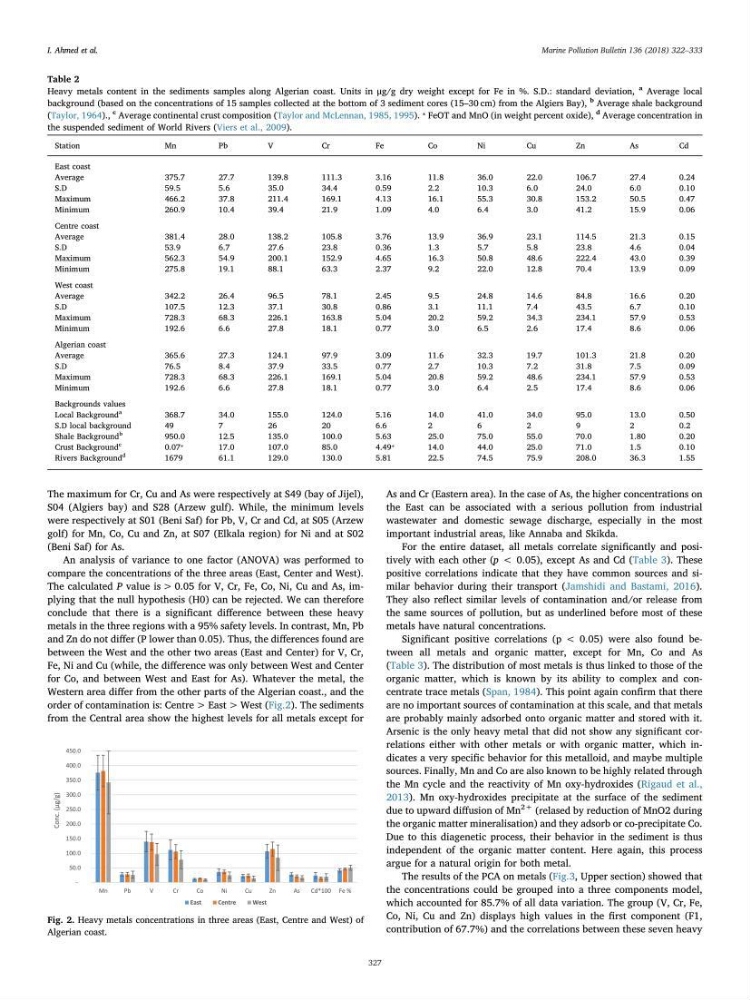
order of contamination is: Centre > East > West (Fig.2). The sediments
from the Central area show the highest levels for all metals except for
As and Cr (Eastern area). In the case of As, the higher concentrations on
the East can be associated with a serious pollution from industrial
wastewater and domestic sewage discharge, especially in the most
important industrial areas, like Annaba and Skikda.
For the entire dataset, all metals correlate significantly and positively with each other (p < 0.05), except As and Cd (Table 3). These
positive correlations indicate that they have common sources and similar behavior during their transport (Jamshidi and Bastami, 2016).
They also reflect similar levels of contamination and/or release from
the same sources of pollution, but as underlined before most of these
metals have natural concentrations.
Significant positive correlations (p < 0.05) were also found between all metals and organic matter, except for Mn, Co and As
(Table 3). The distribution of most metals is thus linked to those of the
organic matter, which is known by its ability to complex and concentrate trace metals (Span, 1984). This point again confirm that there
are no important sources of contamination at this scale, and that metals
are probably mainly adsorbed onto organic matter and stored with it.
Arsenic is the only heavy metal that did not show any significant correlations either with other metals or with organic matter, which indicates a very specific behavior for this metalloid, and maybe multiple
sources. Finally, Mn and Co are also known to be highly related through
the Mn cycle and the reactivity of Mn oxy-hydroxides (Rigaud et al.,
2013). Mn oxy-hydroxides precipitate at the surface of the sediment
due to upward diffusion of Mn
2+ (relased by reduction of MnO2 during
the organic matter mineralisation) and they adsorb or co-precipitate Co.
Due to this diagenetic process, their behavior in the sediment is thus
independent of the organic matter content. Here again, this process
argue for a natural origin for both metal.
The results of the PCA on metals (Fig.3, Upper section) showed that
the concentrations could be grouped into a three components model,
which accounted for 85.7% of all data variation. The group (V, Cr, Fe,
Co, Ni, Cu and Zn) displays high values in the first component (F1,
contribution of 67.7%) and the correlations between these seven heavy
Table 2
Heavy metals content in the sediments samples along Algerian coast. Units in μg/g dry weight except for Fe in %. S.D.: standard deviation,
a Average local
background (based on the concentrations of 15 samples collected at the bottom of 3 sediment cores (15–30 cm) from the Algiers Bay),
b Average shale background
(Taylor, 1964).,
c Average continental crust composition (Taylor and McLennan, 1985, 1995).
⁎ FeOT and MnO (in weight percent oxide),
d Average concentration in
the suspended sediment of World Rivers (Viers et al., 2009).
Station
Mn
Pb
V
Cr
Fe
Co
Ni
Cu
Zn
As
Cd
East coast
Average
375.7
27.7
139.8
111.3
3.16
11.8
36.0
22.0
106.7
27.4
0.24
S.D
59.5
5.6
35.0
34.4
0.59
2.2
10.3
6.0
24.0
6.0
0.10
Maximum
466.2
37.8
211.4
169.1
4.13
16.1
55.3
30.8
153.2
50.5
0.47
Minimum
260.9
10.4
39.4
21.9
1.09
4.0
6.4
3.0
41.2
15.9
0.06
Centre coast
Average
381.4
28.0
138.2
105.8
3.76
13.9
36.9
23.1
114.5
21.3
0.15
S.D
53.9
6.7
27.6
23.8
0.36
1.3
5.7
5.8
23.8
4.6
0.04
Maximum
562.3
54.9
200.1
152.9
4.65
16.3
50.8
48.6
222.4
43.0
0.39
Minimum
275.8
19.1
88.1
63.3
2.37
9.2
22.0
12.8
70.4
13.9
0.09
West coast
Average
342.2
26.4
96.5
78.1
2.45
9.5
24.8
14.6
84.8
16.6
0.20
S.D
107.5
12.3
37.1
30.8
0.86
3.1
11.1
7.4
43.5
6.7
0.10
Maximum
728.3
68.3
226.1
163.8
5.04
20.2
59.2
34.3
234.1
57.9
0.53
Minimum
192.6
6.6
27.8
18.1
0.77
3.0
6.5
2.6
17.4
8.6
0.06
Algerian coast
Average
365.6
27.3
124.1
97.9
3.09
11.6
32.3
19.7
101.3
21.8
0.20
S.D
76.5
8.4
37.9
33.5
0.77
2.7
10.3
7.2
31.8
7.5
0.09
Maximum
728.3
68.3
226.1
169.1
5.04
20.8
59.2
48.6
234.1
57.9
0.53
Minimum
192.6
6.6
27.8
18.1
0.77
3.0
6.4
2.5
17.4
8.6
0.06
Backgrounds values
Local Background
a
368.7
34.0
155.0
124.0
5.16
14.0
41.0
34.0
95.0
13.0
0.50
S.D local background
49
7
26
20
6.6
2
6
2
9
2
0 . 2
Shale Background
b
950.0
12.5
135.0
100.0
5.63
25.0
75.0
55.0
70.0
1.80
0.20
Crust Background
c
0.07
⁎
17.0
107.0
85.0
4.49
⁎
14.0
44.0
25.0
71.0
1.5
0.10
Rivers Background
d
1679
61.1
129.0
130.0
5.81
22.5
74.5
75.9
208.0
36.3
1.55
Fig. 2. Heavy metals concentrations in three areas (East, Centre and West) of
Algerian coast.
I. Ahmed et al.
Marine Pollution Bulletin 136 (2018) 322–333
327
S04 (Algiers bay) and S28 (Arzew gulf). While, the minimum levels
were respectively at S01 (Beni Saf) for Pb, V, Cr and Cd, at S05 (Arzew
golf) for Mn, Co, Cu and Zn, at S07 (Elkala region) for Ni and at S02
(Beni Saf) for As.
An analysis of variance to one factor (ANOVA) was performed to
compare the concentrations of the three areas (East, Center and West).
The calculated P value is > 0.05 for V, Cr, Fe, Co, Ni, Cu and As, implying that the null hypothesis (H0) can be rejected. We can therefore
conclude that there is a significant difference between these heavy
metals in the three regions with a 95% safety levels. In contrast, Mn, Pb
and Zn do not differ (P lower than 0.05). Thus, the differences found are
between the West and the other two areas (East and Center) for V, Cr,
Fe, Ni and Cu (while, the difference was only between West and Center
for Co, and between West and East for As). Whatever the metal, the
Western area differ from the other parts of the Algerian coast., and the
order of contamination is: Centre > East > West (Fig.2). The sediments
from the Central area show the highest levels for all metals except for
As and Cr (Eastern area). In the case of As, the higher concentrations on
the East can be associated with a serious pollution from industrial
wastewater and domestic sewage discharge, especially in the most
important industrial areas, like Annaba and Skikda.
For the entire dataset, all metals correlate significantly and positively with each other (p < 0.05), except As and Cd (Table 3). These
positive correlations indicate that they have common sources and similar behavior during their transport (Jamshidi and Bastami, 2016).
They also reflect similar levels of contamination and/or release from
the same sources of pollution, but as underlined before most of these
metals have natural concentrations.
Significant positive correlations (p < 0.05) were also found between all metals and organic matter, except for Mn, Co and As
(Table 3). The distribution of most metals is thus linked to those of the
organic matter, which is known by its ability to complex and concentrate trace metals (Span, 1984). This point again confirm that there
are no important sources of contamination at this scale, and that metals
are probably mainly adsorbed onto organic matter and stored with it.
Arsenic is the only heavy metal that did not show any significant correlations either with other metals or with organic matter, which indicates a very specific behavior for this metalloid, and maybe multiple
sources. Finally, Mn and Co are also known to be highly related through
the Mn cycle and the reactivity of Mn oxy-hydroxides (Rigaud et al.,
2013). Mn oxy-hydroxides precipitate at the surface of the sediment
due to upward diffusion of Mn
2+ (relased by reduction of MnO2 during
the organic matter mineralisation) and they adsorb or co-precipitate Co.
Due to this diagenetic process, their behavior in the sediment is thus
independent of the organic matter content. Here again, this process
argue for a natural origin for both metal.
The results of the PCA on metals (Fig.3, Upper section) showed that
the concentrations could be grouped into a three components model,
which accounted for 85.7% of all data variation. The group (V, Cr, Fe,
Co, Ni, Cu and Zn) displays high values in the first component (F1,
contribution of 67.7%) and the correlations between these seven heavy
Table 2
Heavy metals content in the sediments samples along Algerian coast. Units in μg/g dry weight except for Fe in %. S.D.: standard deviation,
a Average local
background (based on the concentrations of 15 samples collected at the bottom of 3 sediment cores (15–30 cm) from the Algiers Bay),
b Average shale background
(Taylor, 1964).,
c Average continental crust composition (Taylor and McLennan, 1985, 1995).
⁎ FeOT and MnO (in weight percent oxide),
d Average concentration in
the suspended sediment of World Rivers (Viers et al., 2009).
Station
Mn
Pb
V
Cr
Fe
Co
Ni
Cu
Zn
As
Cd
East coast
Average
375.7
27.7
139.8
111.3
3.16
11.8
36.0
22.0
106.7
27.4
0.24
S.D
59.5
5.6
35.0
34.4
0.59
2.2
10.3
6.0
24.0
6.0
0.10
Maximum
466.2
37.8
211.4
169.1
4.13
16.1
55.3
30.8
153.2
50.5
0.47
Minimum
260.9
10.4
39.4
21.9
1.09
4.0
6.4
3.0
41.2
15.9
0.06
Centre coast
Average
381.4
28.0
138.2
105.8
3.76
13.9
36.9
23.1
114.5
21.3
0.15
S.D
53.9
6.7
27.6
23.8
0.36
1.3
5.7
5.8
23.8
4.6
0.04
Maximum
562.3
54.9
200.1
152.9
4.65
16.3
50.8
48.6
222.4
43.0
0.39
Minimum
275.8
19.1
88.1
63.3
2.37
9.2
22.0
12.8
70.4
13.9
0.09
West coast
Average
342.2
26.4
96.5
78.1
2.45
9.5
24.8
14.6
84.8
16.6
0.20
S.D
107.5
12.3
37.1
30.8
0.86
3.1
11.1
7.4
43.5
6.7
0.10
Maximum
728.3
68.3
226.1
163.8
5.04
20.2
59.2
34.3
234.1
57.9
0.53
Minimum
192.6
6.6
27.8
18.1
0.77
3.0
6.5
2.6
17.4
8.6
0.06
Algerian coast
Average
365.6
27.3
124.1
97.9
3.09
11.6
32.3
19.7
101.3
21.8
0.20
S.D
76.5
8.4
37.9
33.5
0.77
2.7
10.3
7.2
31.8
7.5
0.09
Maximum
728.3
68.3
226.1
169.1
5.04
20.8
59.2
48.6
234.1
57.9
0.53
Minimum
192.6
6.6
27.8
18.1
0.77
3.0
6.4
2.5
17.4
8.6
0.06
Backgrounds values
Local Background
a
368.7
34.0
155.0
124.0
5.16
14.0
41.0
34.0
95.0
13.0
0.50
S.D local background
49
7
26
20
6.6
2
6
2
9
2
0 . 2
Shale Background
b
950.0
12.5
135.0
100.0
5.63
25.0
75.0
55.0
70.0
1.80
0.20
Crust Background
c
0.07
⁎
17.0
107.0
85.0
4.49
⁎
14.0
44.0
25.0
71.0
1.5
0.10
Rivers Background
d
1679
61.1
129.0
130.0
5.81
22.5
74.5
75.9
208.0
36.3
1.55
Fig. 2. Heavy metals concentrations in three areas (East, Centre and West) of
Algerian coast.
I. Ahmed et al.
Marine Pollution Bulletin 136 (2018) 322–333
327