

476
G.E. Glass et al.
3
Results and Discussion
3.1
Mercury in Surface Sediments (0-10 and 10-20 cm)
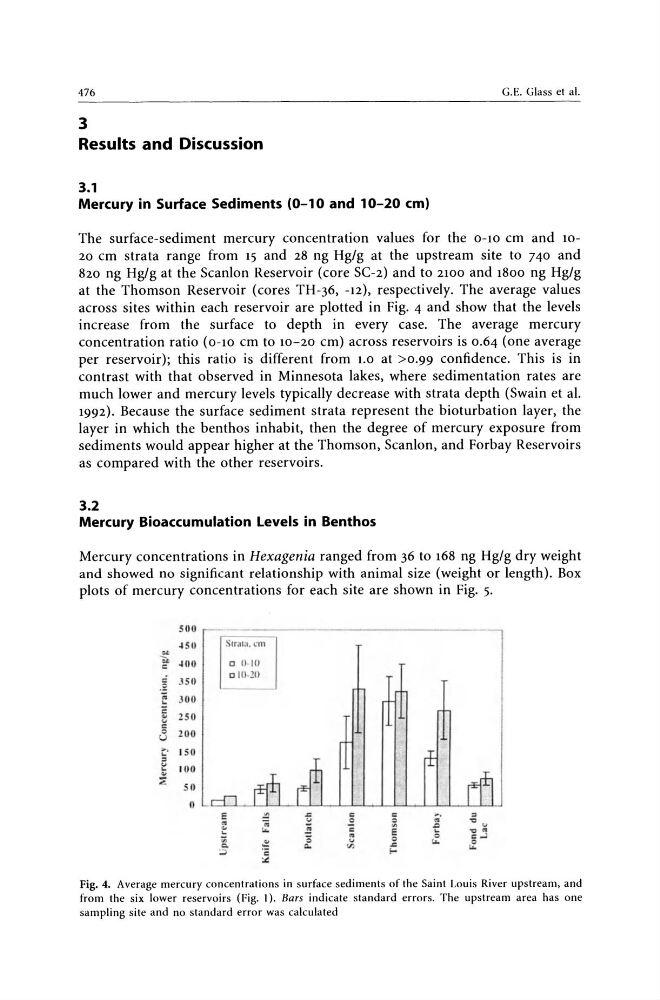
The surface-sediment mercury concentration values for the 0-10 em and 1020 em strata range from 15 and 28 ng Hg/g at the upstream site to 740 and
820 ng Hg/g at the Scanlon Reservoir (core SC-2) and to 2100 and 1800 ng Hg/g
at the Thomson Reservoir (cores TH-36, -l2), respectively. The average values
across sites within each reservoir are plotted in Fig. 4 and show that the levels
increase from the surface to depth in every case. The average mercury
concentration ratio (0-10 cm to 10-20 em) across reservoirs is 0.64 (one average
per reservoir); this ratio is different from 1.0 at >0.99 confidence. This is in
contrast with that observed in Minnesota lakes, where sedimentation rates are
much lower and mercury levels typically decrease with strata depth (Swain et al.
1992). Because the surface sediment strata represent the bioturbation layer, the
layer in which the benthos inhabit, then the degree of mercury exposure from
sediments would appear higher at the Thomson, Scanlon, and Forbay Reservoirs
as compared with the other reservoirs.
3.2
Mercury Bioaccumulation Levels in Benthos
Mercury concentrations in Hexagenia ranged from 36 to 168 ng Hg/g dry weight
and showed no significant relationship with animal size (weight or length). Box
plots of mercury concentrations for each site are shown in Fig. 5.
sno
~ 5U
Slr,lta, 1,. ' 111
. .
~ ~oo
c 11 · 11)
c:
C 350
c 10 ·20
.:<
e 300
;:
. . 250
... c: 0 zoo
u
t- 150
" ~ 100
..
::; 5 0
0
E
~
.r.
c:
c:
,.
::I
"
;;
E
-'!
::I
.. " ...
t
...
c
E
-e
v'"
~
:;
. . ::I 0 C..J
~
"
""
Q.
0..
'"
.c
...
~
. "
...
:.:
Fig. 4. Average mercury concentrations in surface sediments of the Saint Louis River upstream, and
from the six lower reservoirs (Fig. I). Bars indicate standard errors. The upstream area has one
sampling site and no standard error was calculated
G.E. Glass et al.
3
Results and Discussion
3.1
Mercury in Surface Sediments (0-10 and 10-20 cm)
The surface-sediment mercury concentration values for the 0-10 em and 1020 em strata range from 15 and 28 ng Hg/g at the upstream site to 740 and
820 ng Hg/g at the Scanlon Reservoir (core SC-2) and to 2100 and 1800 ng Hg/g
at the Thomson Reservoir (cores TH-36, -l2), respectively. The average values
across sites within each reservoir are plotted in Fig. 4 and show that the levels
increase from the surface to depth in every case. The average mercury
concentration ratio (0-10 cm to 10-20 em) across reservoirs is 0.64 (one average
per reservoir); this ratio is different from 1.0 at >0.99 confidence. This is in
contrast with that observed in Minnesota lakes, where sedimentation rates are
much lower and mercury levels typically decrease with strata depth (Swain et al.
1992). Because the surface sediment strata represent the bioturbation layer, the
layer in which the benthos inhabit, then the degree of mercury exposure from
sediments would appear higher at the Thomson, Scanlon, and Forbay Reservoirs
as compared with the other reservoirs.
3.2
Mercury Bioaccumulation Levels in Benthos
Mercury concentrations in Hexagenia ranged from 36 to 168 ng Hg/g dry weight
and showed no significant relationship with animal size (weight or length). Box
plots of mercury concentrations for each site are shown in Fig. 5.
sno
~ 5U
Slr,lta, 1,. ' 111
. .
~ ~oo
c 11 · 11)
c:
C 350
c 10 ·20
.:<
e 300
;:
. . 250
... c: 0 zoo
u
t- 150
" ~ 100
..
::; 5 0
0
E
~
.r.
c:
c:
,.
::I
"
;;
E
-'!
::I
.. " ...
t
...
c
E
-e
v'"
~
:;
. . ::I 0 C..J
~
"
""
Q.
0..
'"
.c
...
~
. "
...
:.:
Fig. 4. Average mercury concentrations in surface sediments of the Saint Louis River upstream, and
from the six lower reservoirs (Fig. I). Bars indicate standard errors. The upstream area has one
sampling site and no standard error was calculated