

Mercury Subsurface Maxima in Sediments
475
2.3.3
Statistical Analysis
Statistical analysis were performed using Systat and Excell software and Apple
Macintosh computers.
2.4
Quality Assurance
2.4.1
Mercury Measurements
Analytical precision was determined by analyzing every tenth sample in
duplicate. At least 1 out of every 15 samples was also analyzed for spike
recovery. The standard addition was added as mercuric chloride in a dichromate/
nitric acid preservative matrix. Analytical method blanks (four per run) were
prepared by adding all analytical reagents to a flask that contained no sample.
Two certified sediment (NBS 1645) or tissue samples (NRC DORM-I) were
included in each sediment and benthos analyses run, respectively.
Acceptance criteria for quality assurance checks were ± 20% for accuracy
and ± 30% for precision. Samples which failed to meet acceptance criteria for an
analytical run were reanalyzed.
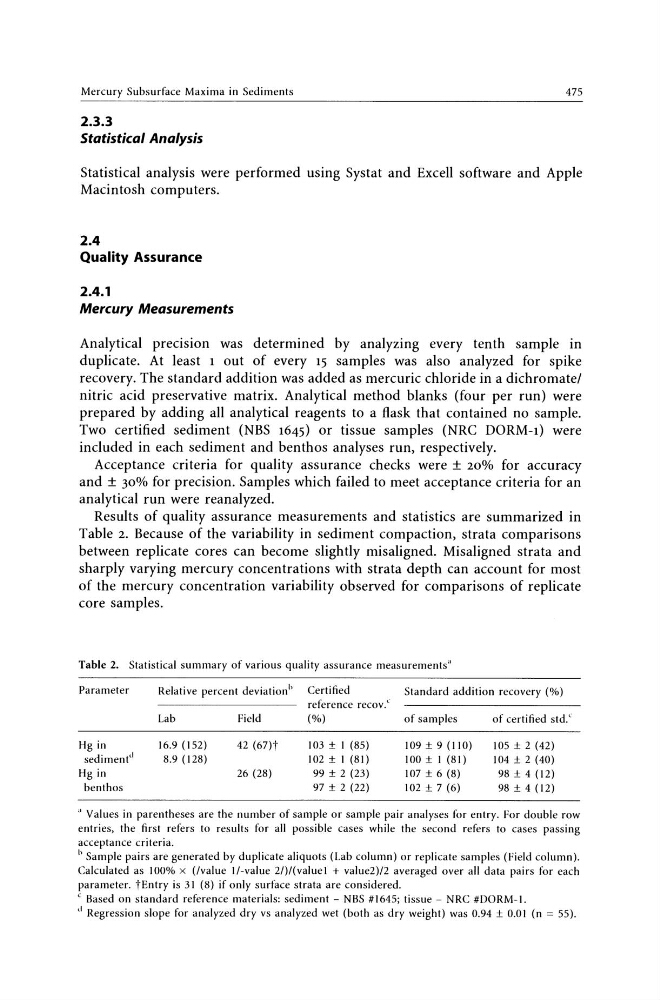
Results of quality assurance measurements and statistics are summarized in
Table 2. Because of the variability in sediment compaction, strata comparisons
between replicate cores can become slightly misaligned. Misaligned strata and
sharply varying mercury concentrations with strata depth can account for most
of the mercury concentration variability observed for comparisons of replicate
core samples.
Table 2. Statistical summary of various quality assurance measurements"
Parameter
Relative percent deviation b Certified
Standard addition recovery (%)
reference reeov.':
Lab
Field
(%)
of samples
of certified std:
Hg in
16.9 (152)
42 (67)t
103 ± I (85)
109 ± 9 (110)
105 ± 2 (42)
sediInent d
8.9 (128)
102 ± I (81)
100 ± I (81)
104 ± 2 (40)
Hg in
26 (28)
99 ± 2 (23)
107 ± 6 (8)
98 ± 4 (I2)
benthos
97 ± 2 (22)
102 ± 7 (6)
98 ± 4 (12)
., Values in parentheses are the number of sample or sample pair analyses for entry. For double row
entries, the first refers to results for all possible cases while the second refers to cases passing
acceptance criteria.
b Sample pairs are generated by duplicate aliquots (Lab column) or replicate samples (Field column).
Calculated as 100% x Uvalue II-value 2/)/(valuel + value2)/2 averaged over all data pairs for each
parameter. tEn try is 31 (8) if only surface strata are considered.
C Based on standard reference materials: sediment - NBS #1645; tissue - NRC #DORM-l.
d Regression slope for analyzed dry vs analyzed wet (both as dry weight) was 0.94 ± 0.01 (n = 55).
475
2.3.3
Statistical Analysis
Statistical analysis were performed using Systat and Excell software and Apple
Macintosh computers.
2.4
Quality Assurance
2.4.1
Mercury Measurements
Analytical precision was determined by analyzing every tenth sample in
duplicate. At least 1 out of every 15 samples was also analyzed for spike
recovery. The standard addition was added as mercuric chloride in a dichromate/
nitric acid preservative matrix. Analytical method blanks (four per run) were
prepared by adding all analytical reagents to a flask that contained no sample.
Two certified sediment (NBS 1645) or tissue samples (NRC DORM-I) were
included in each sediment and benthos analyses run, respectively.
Acceptance criteria for quality assurance checks were ± 20% for accuracy
and ± 30% for precision. Samples which failed to meet acceptance criteria for an
analytical run were reanalyzed.
Results of quality assurance measurements and statistics are summarized in
Table 2. Because of the variability in sediment compaction, strata comparisons
between replicate cores can become slightly misaligned. Misaligned strata and
sharply varying mercury concentrations with strata depth can account for most
of the mercury concentration variability observed for comparisons of replicate
core samples.
Table 2. Statistical summary of various quality assurance measurements"
Parameter
Relative percent deviation b Certified
Standard addition recovery (%)
reference reeov.':
Lab
Field
(%)
of samples
of certified std:
Hg in
16.9 (152)
42 (67)t
103 ± I (85)
109 ± 9 (110)
105 ± 2 (42)
sediInent d
8.9 (128)
102 ± I (81)
100 ± I (81)
104 ± 2 (40)
Hg in
26 (28)
99 ± 2 (23)
107 ± 6 (8)
98 ± 4 (I2)
benthos
97 ± 2 (22)
102 ± 7 (6)
98 ± 4 (12)
., Values in parentheses are the number of sample or sample pair analyses for entry. For double row
entries, the first refers to results for all possible cases while the second refers to cases passing
acceptance criteria.
b Sample pairs are generated by duplicate aliquots (Lab column) or replicate samples (Field column).
Calculated as 100% x Uvalue II-value 2/)/(valuel + value2)/2 averaged over all data pairs for each
parameter. tEn try is 31 (8) if only surface strata are considered.
C Based on standard reference materials: sediment - NBS #1645; tissue - NRC #DORM-l.
d Regression slope for analyzed dry vs analyzed wet (both as dry weight) was 0.94 ± 0.01 (n = 55).