

386
O. Kriiger et al.
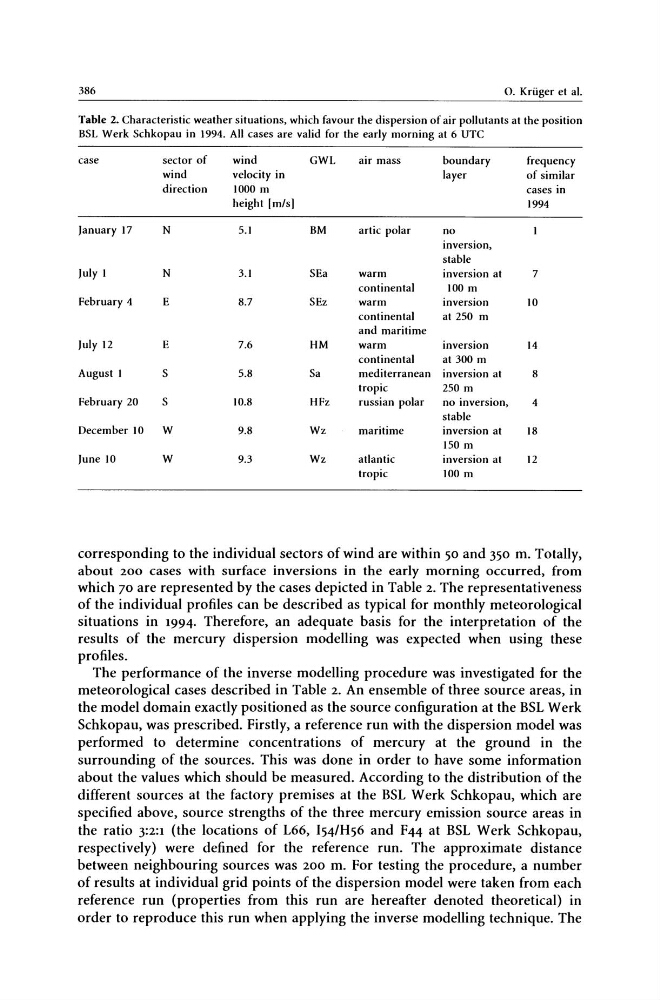
Table 2. Characteristic weather situations, which favour the dispersion of air pollutants at the position
BSL Werk Schkopau in 1994. All cases are valid for the early morning at 6 UTC
case
sector of
wind
GWL
air mass
boundary
frequency
wind
velocity in
layer
of similar
direction
1000 m
cases in
height Im/s]
1994
January 17
N
5.1
BM
artic polar
no
inversion,
stable
July I
N
3.1
SEa
warm
inversion at
7
continental
100 m
February 4
E
8.7
SEz
warm
inversion
10
continental
at 250 m
and maritime
July 12
E
7.6
HM
warm
inversion
14
continental
at 300 m
August I
S
5.8
Sa
mediterranean inversion at
8
tropic
250 m
February 20
S
10.8
HFz
russian polar
no inversion,
4
stable
December 10
W
9.8
Wz
maritime
inversion at
18
150 m
June 10
W
9.3
Wz
atlantic
inversion at
12
tropic
100 m
corresponding to the individual sectors of wind are within 50 and 350 m. Totally,
about 200 cases with surface inversions in the early morning occurred, from
which 70 are represented by the cases depicted in Table 2. The representativeness
of the individual profiles can be described as typical for monthly meteorological
situations in 1994. Therefore, an adequate basis for the interpretation of the
results of the mercury dispersion modelling was expected when using these
profiles.
The performance of the inverse modelling procedure was investigated for the
meteorological cases described in Table 2. An ensemble of three source areas, in
the model domain exactly positioned as the source configuration at the BSL Werk
Schkopau, was prescribed. Firstly, a reference run willi the dispersion model was
performed to determine concentrations of mercury at the ground in the
surrounding of the sources. This was done in order to have some information
about the values which should be measured. According to the distribution of the
different sources at the factory premises at the BSL Werk Schkopau, which are
specified above, source strengths of the three mercury emission source areas in
the ratio 3:2:1 (the locations of L66, 154/H56 and F44 at BSL Werk Schkopau,
respectively) were defined for the reference run. The approximate distance
between neighbouring sources was 200 m. For testing the procedure, a number
of results at individual grid points of the dispersion model were taken from each
reference run (properties from this run are hereafter denoted theoretical) in
order to reproduce this run when applying the inverse modelling technique. The
O. Kriiger et al.
Table 2. Characteristic weather situations, which favour the dispersion of air pollutants at the position
BSL Werk Schkopau in 1994. All cases are valid for the early morning at 6 UTC
case
sector of
wind
GWL
air mass
boundary
frequency
wind
velocity in
layer
of similar
direction
1000 m
cases in
height Im/s]
1994
January 17
N
5.1
BM
artic polar
no
inversion,
stable
July I
N
3.1
SEa
warm
inversion at
7
continental
100 m
February 4
E
8.7
SEz
warm
inversion
10
continental
at 250 m
and maritime
July 12
E
7.6
HM
warm
inversion
14
continental
at 300 m
August I
S
5.8
Sa
mediterranean inversion at
8
tropic
250 m
February 20
S
10.8
HFz
russian polar
no inversion,
4
stable
December 10
W
9.8
Wz
maritime
inversion at
18
150 m
June 10
W
9.3
Wz
atlantic
inversion at
12
tropic
100 m
corresponding to the individual sectors of wind are within 50 and 350 m. Totally,
about 200 cases with surface inversions in the early morning occurred, from
which 70 are represented by the cases depicted in Table 2. The representativeness
of the individual profiles can be described as typical for monthly meteorological
situations in 1994. Therefore, an adequate basis for the interpretation of the
results of the mercury dispersion modelling was expected when using these
profiles.
The performance of the inverse modelling procedure was investigated for the
meteorological cases described in Table 2. An ensemble of three source areas, in
the model domain exactly positioned as the source configuration at the BSL Werk
Schkopau, was prescribed. Firstly, a reference run willi the dispersion model was
performed to determine concentrations of mercury at the ground in the
surrounding of the sources. This was done in order to have some information
about the values which should be measured. According to the distribution of the
different sources at the factory premises at the BSL Werk Schkopau, which are
specified above, source strengths of the three mercury emission source areas in
the ratio 3:2:1 (the locations of L66, 154/H56 and F44 at BSL Werk Schkopau,
respectively) were defined for the reference run. The approximate distance
between neighbouring sources was 200 m. For testing the procedure, a number
of results at individual grid points of the dispersion model were taken from each
reference run (properties from this run are hereafter denoted theoretical) in
order to reproduce this run when applying the inverse modelling technique. The