

Evaluation of Intern al Doses of Mercury at Intermittent Exposure to Elemental Mercury
275
~ B-Hg
70
D E-Hg
60~P_H9rdll
50
40
30
20
10
..
o
I
E/P ratio
%ofHg
in PCV-'
before exposure
0_92
35.2
after exposure
0.72
29_8
p= 0.009
p= 0.008
• ratio measured directly
., packet cell volume
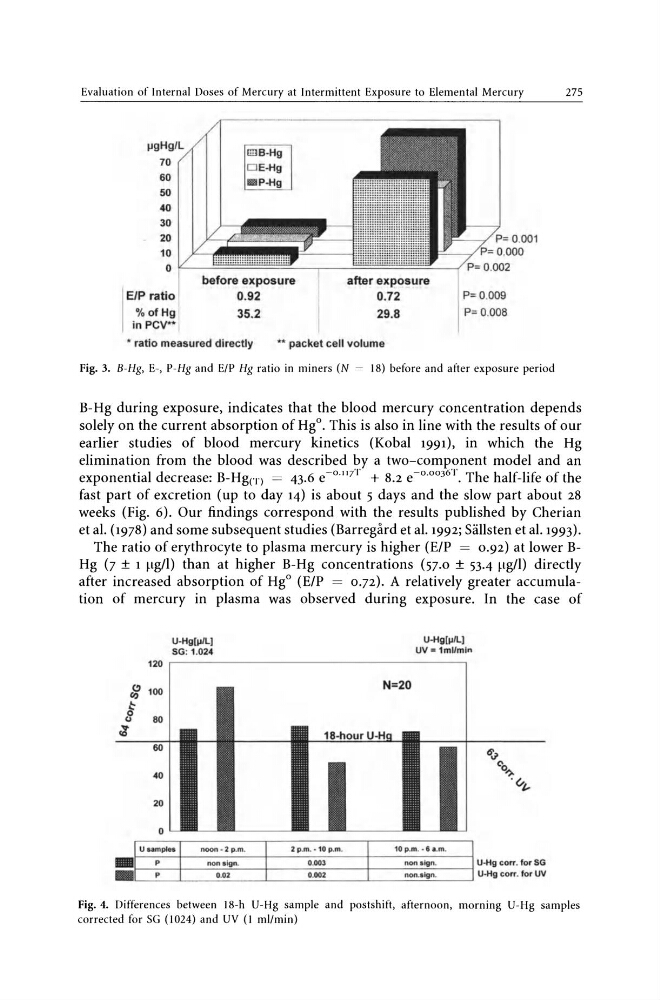
Fig. 3. B-Hg, E-, P-Hg and E/P Hg ratio in miners (N = IS) before and after exposure period
B-Hg during exposure, indicates that the blood mercury concentration depends
solely on the current absorption of Hgo. This is also in line with the results of our
earlier studies of blood mercury kinetics (Kobal 1991), in which the Hg
elimination from the blood was described by a two-component model and an
exponential decrease: B-Hgcn = 43.6 e- o. llir + 8.2 e- O.0036T. The half-life of the
fast part of excretion (up to day 14) is about 5 days and the slow part about 28
weeks (Fig. 6). Our findings correspond with the results published by Cherian
et at. (1978) and some subsequent studies (Barregard et at. 1992; SiilIsten et aL 1993).
The ratio of erythrocyte to plasma mercury is higher (E/P = 0_92) at lower BHg (7 ± I ~lg/l) than at higher B-Hg concentrations (57.0 ± 53.4 ~tg/l) directly
after increased absorption of HgO (E/P = 0 .72). A relatively greater accumulation of mercury in plasma was observed during exposure. In the case of
0
'"
l:
8
J
120
100
80
60
40
U-Hg["/L]
SG: 1. 024
N=20
U-Hg["/Ll
uv; lmllmln
- 1--':-_I---';.:;;.;"""'_ -+ ___ o ::.;. OO:::' ; . - _ - l _ _ -' n:.:.Ofl .:..:' cc-Il Ic::n ._ - - l U·Hg corr. for SG
. .
0.002
non.1IIgn.
U-Hg corr. for UV
Fig. 4. Differences between JS-h U-Hg sample and postshift, afternoon, morning U-Hg samples
corrected for SG (1024) and UV (I ml/min)
275
~ B-Hg
70
D E-Hg
60~P_H9rdll
50
40
30
20
10
..
o
I
E/P ratio
%ofHg
in PCV-'
before exposure
0_92
35.2
after exposure
0.72
29_8
p= 0.009
p= 0.008
• ratio measured directly
., packet cell volume
Fig. 3. B-Hg, E-, P-Hg and E/P Hg ratio in miners (N = IS) before and after exposure period
B-Hg during exposure, indicates that the blood mercury concentration depends
solely on the current absorption of Hgo. This is also in line with the results of our
earlier studies of blood mercury kinetics (Kobal 1991), in which the Hg
elimination from the blood was described by a two-component model and an
exponential decrease: B-Hgcn = 43.6 e- o. llir + 8.2 e- O.0036T. The half-life of the
fast part of excretion (up to day 14) is about 5 days and the slow part about 28
weeks (Fig. 6). Our findings correspond with the results published by Cherian
et at. (1978) and some subsequent studies (Barregard et at. 1992; SiilIsten et aL 1993).
The ratio of erythrocyte to plasma mercury is higher (E/P = 0_92) at lower BHg (7 ± I ~lg/l) than at higher B-Hg concentrations (57.0 ± 53.4 ~tg/l) directly
after increased absorption of HgO (E/P = 0 .72). A relatively greater accumulation of mercury in plasma was observed during exposure. In the case of
0
'"
l:
8
J
120
100
80
60
40
U-Hg["/L]
SG: 1. 024
N=20
U-Hg["/Ll
uv; lmllmln
- 1--':-_I---';.:;;.;"""'_ -+ ___ o ::.;. OO:::' ; . - _ - l _ _ -' n:.:.Ofl .:..:' cc-Il Ic::n ._ - - l U·Hg corr. for SG
. .
0.002
non.1IIgn.
U-Hg corr. for UV
Fig. 4. Differences between JS-h U-Hg sample and postshift, afternoon, morning U-Hg samples
corrected for SG (1024) and UV (I ml/min)