

276
A. Kobal et al.
Post - shift
1200 U-Hg (~g/L , SG: 1. 024)
N =18
1000
800
.... E-Hg r = 0.70 P = 0.002
.... P-Hg r = 0.82 P = 0.000
600
400
200
0
0
50
100
150
200
250
300
350
E- and P-Hg [~g/L)
• regression coefficients are significant at P
miners in the postexposure period
simultaneous occupational exposure to Hgo and exposure of methylmercury
(Me-Hg) from nutrition, the distribution of inorganic mercury between
erythrocytes and plasma is even more in favour of the latter (Suzuki et al.
1970). The results of our studies (Horvat and Kobal, unpubl.), conducted on 18
females who live in an environment not exposed to Hgo and do not eat seafood,
showed that, at very low total blood mercury values (in a range of up to 2 ng/g),
the average E/P ratios of Me-Hg and inorganic mercury were 5.3 and 0.91,
respectively. Our results suggested that the distribution of mercury among
erythrocytes and plasma is relatively uniform at lower inorganic mercury
concentrations in blood; the relative increase in inorganic Hg in plasma after
exposure to HgO is evidently the result of increased absorption.
Blood - Hg (lJg/L)
60
50
40
C(T) = 43.6e<>·117T + 8.2e -O .0035T
30
20
10
o
.04
7
14
30
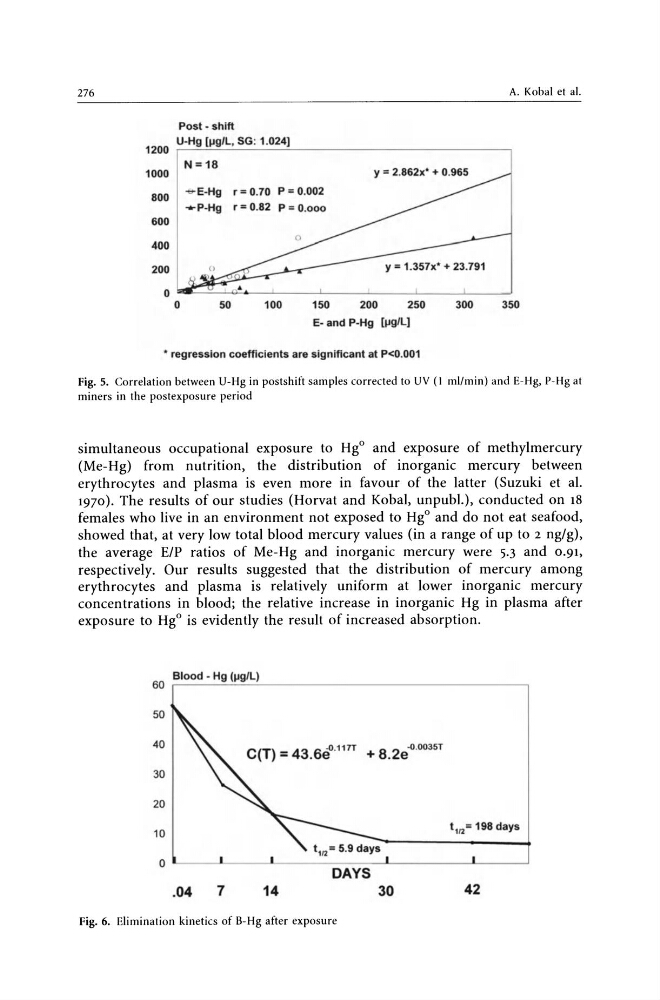
Fig. 6. Elimination kinetics of B- Hg after exposure
42
A. Kobal et al.
Post - shift
1200 U-Hg (~g/L , SG: 1. 024)
N =18
1000
800
.... E-Hg r = 0.70 P = 0.002
.... P-Hg r = 0.82 P = 0.000
600
400
200
0
0
50
100
150
200
250
300
350
E- and P-Hg [~g/L)
• regression coefficients are significant at P
miners in the postexposure period
simultaneous occupational exposure to Hgo and exposure of methylmercury
(Me-Hg) from nutrition, the distribution of inorganic mercury between
erythrocytes and plasma is even more in favour of the latter (Suzuki et al.
1970). The results of our studies (Horvat and Kobal, unpubl.), conducted on 18
females who live in an environment not exposed to Hgo and do not eat seafood,
showed that, at very low total blood mercury values (in a range of up to 2 ng/g),
the average E/P ratios of Me-Hg and inorganic mercury were 5.3 and 0.91,
respectively. Our results suggested that the distribution of mercury among
erythrocytes and plasma is relatively uniform at lower inorganic mercury
concentrations in blood; the relative increase in inorganic Hg in plasma after
exposure to HgO is evidently the result of increased absorption.
Blood - Hg (lJg/L)
60
50
40
C(T) = 43.6e<>·117T + 8.2e -O .0035T
30
20
10
o
.04
7
14
30
Fig. 6. Elimination kinetics of B- Hg after exposure
42